![]()
Preserve peak network performance with packet loss testing
- Continuously monitor data packets and test packet loss
- Get alerted about connectivity and performance issues
- Keep your network highly available, fast, and stable
Our users give top ratings for monitoring with Paessler PRTG


PRTG packet loss test: What you’ll find on this page
PRTG makes spotting and troubleshooting network performance issues easy
Custom alerts and data visualizations make it easy to monitor, identify, and prevent packet loss and network instability issues.
Stop the silent performance killer in its tracks
Static-filled calls. Dropped connections. Missing files. Corrupted data.
Packet loss can cause trouble across your organization and make it impossible for everyone to do their jobs. But you won't know it's a problem unless you check.
Paessler PRTG monitors your network – including your internet connection – round the clock and alerts you if there are issues you need to fix, so you can ensure it continues to perform at 100%.
Secure superior network performance with PRTG
In PRTG, “sensors” are the basic monitoring elements. One sensor usually monitors one measured value in your network, e.g. the traffic of a switch port, the CPU load of a server, the free space of a disk drive. On average you need about 5-10 sensors per device or one sensor per switch port. ![]() How PRTG defines sensors
How PRTG defines sensors
Accurate and reliable
PRTG is precision-engineered to detect the slightest packet delays, lags, and timeouts. But our packet loss monitoring tool also monitors duplicate packets, ethernet latency, and even VoIP jitter, reducing the risk a colleague's face will freeze awkwardly during an important call.
Proactive protection
Keep your network stable, with just a slight effort. Once you set up PRTG, it works in the background, twenty-four hours a day. Ensuring everything's working as it should and alerting you of issues promptly, so you can fix them before anyone can notice.
More than just testing packet loss
PRTG also keeps an eye on your traffic, bandwidth, device availability, server load, hardware, and applications. With 250+ preconfigured sensors, monitoring every aspect of your network's health and performance is as simple and straightforward as it gets.
Start testing packet loss with PRTG and see how it can make your network more reliable and your job easier.
“All-around winning “The real beauty of PRTG is the endless possibilities it offers” “Outstanding cloud IT experts agree: Paessler PRTG is a great solution for IT infrastructure monitoring

network monitor”

monitoring”
What packet loss monitoring looks like in PRTG
Diagnose network issues by continuously monitoring data packets. Show network connectivity and performance in real time and visualize data in graphic maps & dashboards to identify problems more easily. Gain the visibility you need to troubleshoot issues and enjoy a faster, more stable network.

Complete monitoring overview in the form of a hierarchical device tree
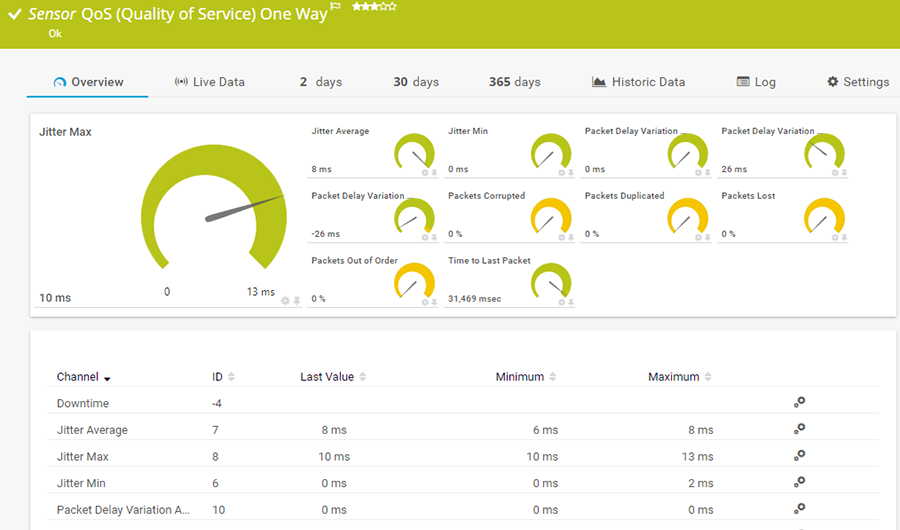
QoS (Quality of Service) One Way sensor in PRTG

Custom PRTG dashboard for visualizing your infrastructure the way you need
Easily find the source of the problem with our PRTG packet loss test solution
Real-time alerts and custom notifications make it easy to solve network connectivity and performance issues.
Double-strength packet loss protection
![]()
Measure packet loss with a PRTG sensor
Our sophisticated QoS (Quality of Service) One Way sensor continuously monitors the quality of a network connection by measuring the packet loss rate between two probes.
You can monitor any connection in your network and measure packet loss on this route by setting up PRTG remote probes close to the route’s endpoints and adding a QoS sensor. The sensor will automatically send data packets between the two probes and alert you if performance falls below your defined threshold.
![]()
Test packet loss with a PRTG custom script
Can't (or won't) create remote probes on more Windows systems? No problem. PRTG's quality-of-service reflector can do it via a Python script that sends packets from your chosen endpoints back to PRTG.
The script can be used on any (Linux) computer, even a small Raspberry Pi. For more information, see our Knowledge Base: How can I monitor QoS round trips without using remote probes?
PRTG also has a whole host of other preconfigured sensors to measure every aspect of your network's connectivity, including:
- The QoS (Quality of Service) Round Trip sensor to monitor the network connection between a probe and a target device, including jitter, MOS, packet delay variation, corrupted packets, and duplicate packets.
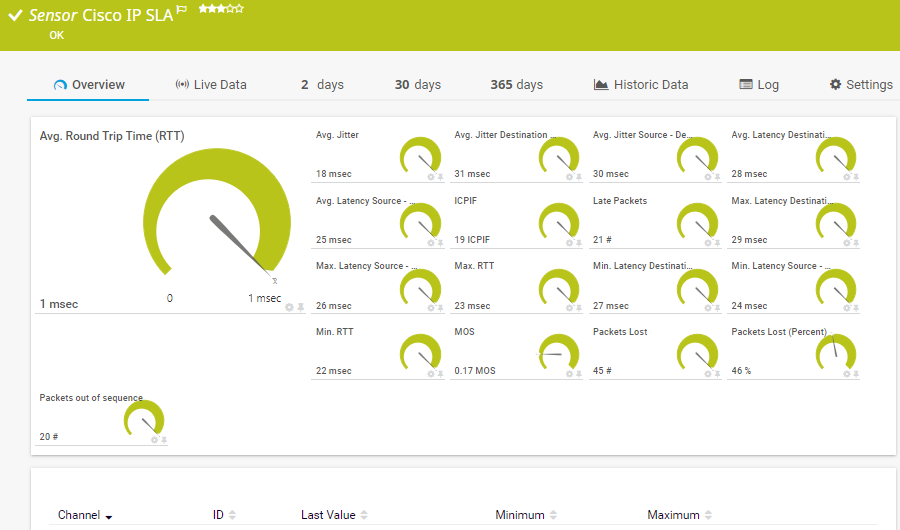
- The Cisco IP SLA sensor to monitor your Cisco devices’ VoIP parameters, including packet loss rate, jitter, latency, MOS, and round-trip time.
- The HTTP v2 sensor to monitor web page or element load times.
- The Ping v2 sensor to monitor device availability.
- The Windows Network Card sensor to monitor bandwidth usage and traffic on a Windows interface, including sent, received, and discarded packets.
Start testing packet loss with PRTG and see how it can make your network more reliable and your job easier.
PRTG is compatible with all major vendors, products, and systems
![]()
Your packet loss monitor at a glance – even on the go
Set up PRTG in minutes and use it on almost any mobile device.


Create innovative solutions with Paessler’s partners
Partnering with innovative vendors, Paessler unleashes synergies to create
new and additional benefits for joined customers.


ScriptRunner
With ScriptRunner, Paessler integrates a powerful event automation platform into PRTG Network Monitor.
UVexplorer integrates tightly with PRTG to bring fast and accurate network discovery, detailed device inventory, and automatic network mapping to the PRTG platform.
UVnetworks
PRTG makes spotting and troubleshooting network performance issues easy
Custom alerts and data visualizations make it easy to monitor, identify, and prevent packet loss and network instability issues.
![]()
“We can all work with greater peace of mind knowing
that our systems are constantly being monitored.”
Markus Puke, Network Administrator, Schüchtermann Klinik, Germany
PRTG packet loss test: FAQ
1. What is packet loss?
Packet loss occurs in networks when data packets are lost during transmission or individual data packets arrive late at their destination. Before being sent, data is packaged into several layers. These packets travel through a variety of different hubs (copper cables, fiber optics, wireless, etc.) to reach their destination. In these hubs, TCP or UDP packets get lost or become delayed. Once sent, each packet is marked with a timestamp.
This value specifies the amount of time the sender must wait before obtaining a confirmation of receipt. If a packet gets lost or is delayed, it eventually “times out.” When this happens, a new packet is sent in its place. This is known as a retransmission timeout (RTO).
The result? It leaves gaps in the information your network needs to do its job, resulting in latency and underperformance.
2. Why run regular packet loss tests?
Packet loss can occur at any point in your network: in cables, routers, switches, and other hardware, especially if it's older or missing important updates, in your Citrix environment, SAP applications, or other cloud-based applications, and in your VoIP or video-conferencing system.
But you might not notice, especially if your colleagues don't report the issue. Regular packet loss tests track your network's performance and let you know the second there's a problem so you can take action, also in the case of wireless packet loss.
3. What is a packet loss tester?
A packet loss tester is a tool or software used to measure the rate at which data packets are lost or dropped while being transmitted across a network. These tools are crucial in evaluating the reliability and performance of a network connection.
Packet loss testers typically work by sending a series of test packets through a network and then analyzing the number of packets that successfully reach their destination compared to the total number sent. This analysis helps determine the percentage of packet loss occurring in the network.
These tools provide insights into network performance, allowing administrators to identify and troubleshoot issues that could be causing packet loss. They are valuable for maintaining and optimizing network efficiency, especially in situations where reliable and consistent data transmission is essential.
4. What is a sensor in PRTG?
In PRTG, “sensors” are the basic monitoring elements. One sensor usually monitors one measured value in your network, for example the traffic of a switch port, the CPU load of a server, or the free space on a disk drive.
On average, you need about 5-10 sensors per device or one sensor per switch port.

PRTG: The multi-tool for sysadmins
Adapt PRTG individually and dynamically to your needs and rely on a strong API:- HTTP API: Access monitoring data and manipulate monitoring objects via HTTP requests
- Custom sensors: Create your own PRTG sensors for customized monitoring
- Custom notifications: Create your own notifications and send action triggers to external systems
- REST Custom sensor: Monitor almost everything that provides data in XML or JSON format
More than just a monitoring tool:
Reasons our customers love PRTG


Paessler PRTG is used by companies of all sizes. Sysadmins love PRTG because it makes their job a whole lot easier. Bandwidth, servers, virtual environments, websites, VoIP services – PRTG keeps an eye on your entire network. Everyone has different monitoring needs. That’s why we let you try PRTG for free.Still not convinced?
![]()
More than 500,000
sysadmins love PRTG![]()
Monitor your entire IT infrastructure
![]()
Try Paessler PRTG
for free
![]()
Start testing packet loss with PRTG and see how it can make your network more reliable and your job easier.
|
PRTG |
Network Monitoring Software - Version 24.2.94.1400 (April 10th, 2024) |
|
Hosting |
Download for Windows and cloud-based version PRTG Hosted Monitor available |
Languages |
English, German, Spanish, French, Portuguese, Dutch, Russian, Japanese, and Simplified Chinese |
Pricing |
Up to 100 sensors for free (Price List) |
Unified Monitoring |
Network devices, bandwidth, servers, applications, virtual environments, remote systems, IoT, and more |
Supported Vendors & Applications |
|