![]()
PRTG keeps an eye on
all your virtual servers

PRTG monitors
your virtual servers
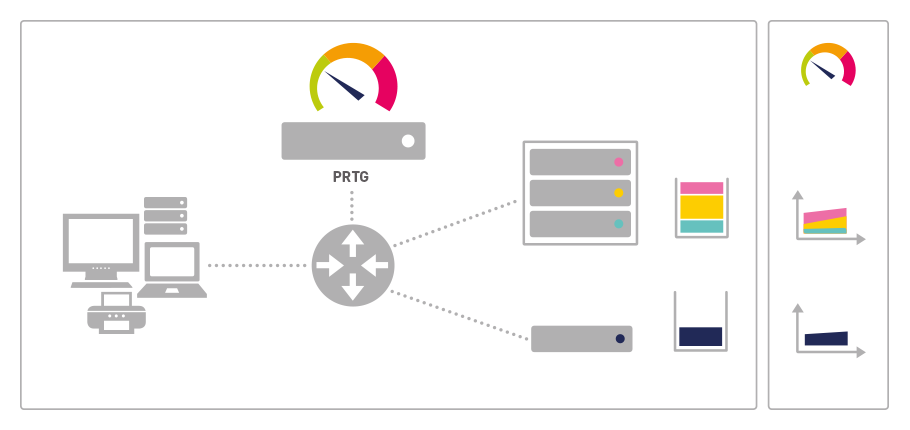
PRTG provides a precise overview of your entire virtual environment
PRTG simplifies
capacity planning
PRTG promptly sends notifications in the event of errors
Virtual server monitoring with PRTG
Jump to the topic of your choice
- Advantages of virtual servers
- Applications connected by virtual environments
- Clustering improves the performance and availability of your servers
- PRTG offers a precise overview of your virtual environment
- Why PRTG is the right tool for virtual server monitoring
- Preconfigured sensors for monitoring virtual servers
- Virtual server sensors in detail
- PRTG works with all big manufacturers
Advantages of virtual servers
Virtual servers are among the most important elements of modern data centers. Virtual servers allow for significant improvements in the area of network performance. They can also optimize the distribution of resources and save money by reducing the need for expensive hardware. With non-virtual environments, sufficient memory and CPU capacity must be allocated to each application manually. With virtual servers, this allocation occurs dynamically. With virtual environments, all the servers and storage units in your network can be seen as one big, powerful computer.
Clustering improves the performance and availability of your servers
![]() Virtualization is the process of creating a virtual version of something like computer hardware. It involves using specialized software to create a virtual or software-created version of a computing resource rather than the actual version of the same resource.
Virtualization is the process of creating a virtual version of something like computer hardware. It involves using specialized software to create a virtual or software-created version of a computing resource rather than the actual version of the same resource.
Read more
Clustering
Upon virtualizing your servers, you have the possibility of merging them into clusters. If one server is down, then another computer in the cluster will automatically take over the virtual machines and applications. By consistently avoiding single points of failure, you’ll improve the availability of your servers.
Intelligent load distribution
Clusters are also used to intelligently distribute the network load to several different machines. This is especially important for environments with high performance requirements.
PRTG offers a precise overview of your virtual environment
Easy-to-read display
Reliable network monitoring software is important for ensuring the proper functioning of dynamic memory allocation. PRTG collects and analyzes all vital network data, then displays this data in easy-to-read charts and graphs. As a result, you get a crystal-clear overview of all your network’s activities. Along with important data regarding your virtual environment, you'll get information on bandwidth, traffic, and individual devices such as routers, switches, and printers.
Automatic notifications
If a virtual server in a cluster goes down, PRTG will send you an alert message at once. You can then take all the necessary steps to prevent more serious problems from arising.
This is how PRTG looks like
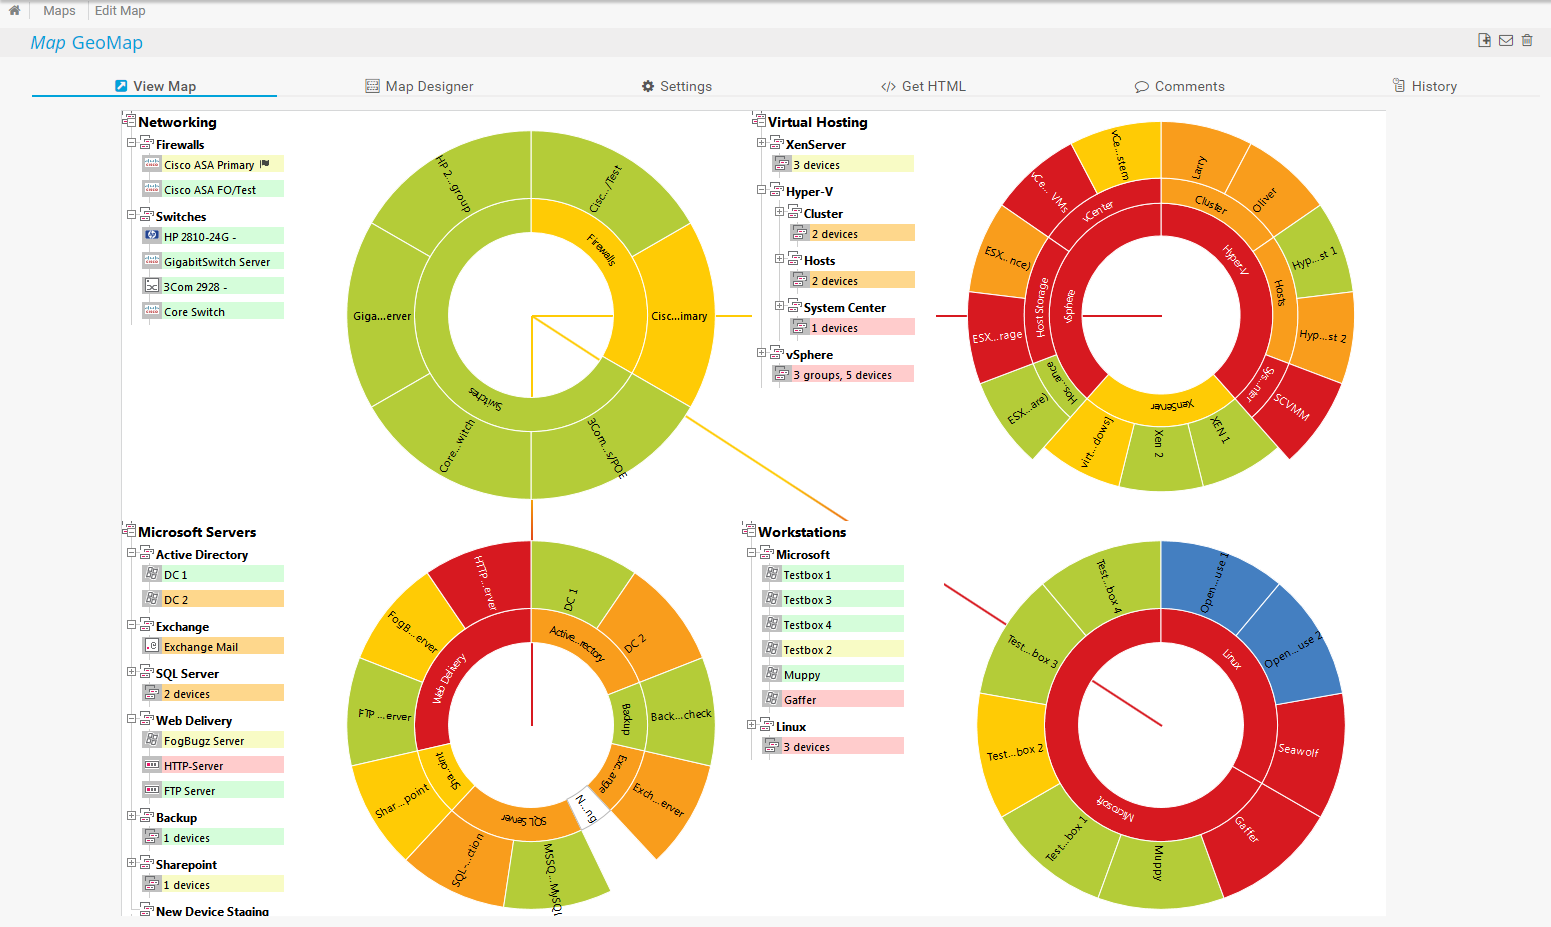
Overview of all important network information
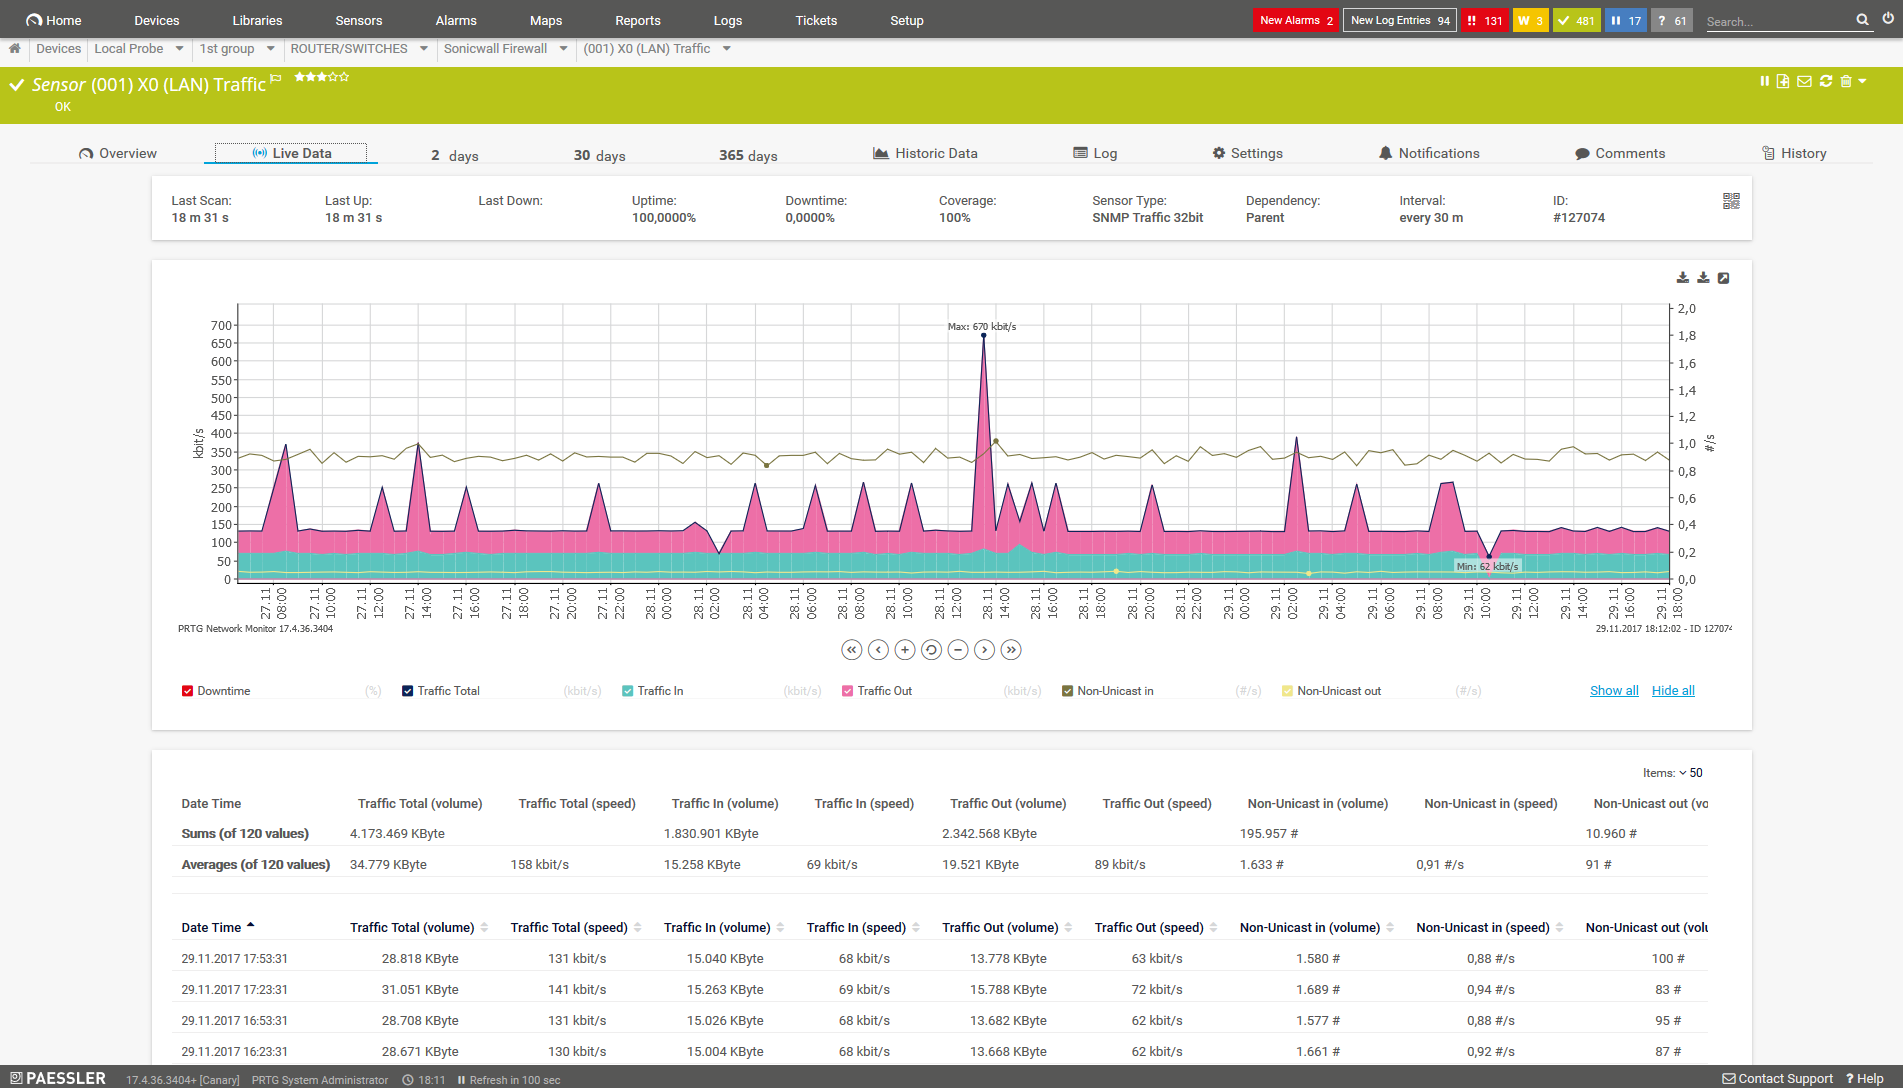
Live traffic
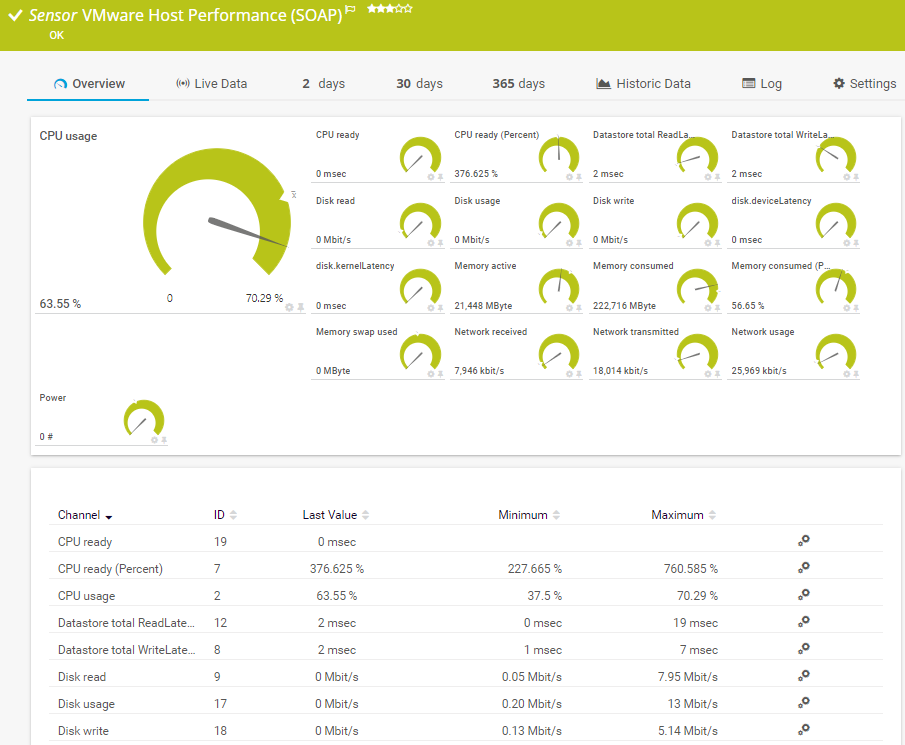
PRTG VMware Host Performance (SOAP) Sensor
Why PRTG is the right tool for virtual server monitoring
![]()
Comprehensive overview
Which virtual machines are running on which computers? How much memory is being used? What is the data transmission rate? PRTG will answer these questions and many more regarding your virtual servers. PRTG lets you create your own custom dashboards, which will allow you to see at a quick glance if your virtual servers are running as planned.
![]()
Detailed statistics
Along with a quick overview, PRTG offers a number of possibilities for taking a closer look. Extensive statistics are available for each measured value. You can, for example, view the average CPU load of the host or the amount of downtime that has occurred during the current year.
Upon request, PRTG will automatically send reports to your colleagues or superiors.
![]()
Straightforward capacity planning
PRTG simplifies the capacity planning process. With your virtual server monitor, you can promptly determine if the network’s capacity needs to be increased. You’ll immediately see if your hardware is overloaded and can react quickly – before an overload leads to poor server performance or errors. The charts of PRTG are extremely easy to read, and therefore perfect for convincing higher-ups (who often lack technical know-how) that it’s a good time to upgrade the network. Conclusive data and statistics eliminate the need for long and nerve-racking discussions.
![]()
Prompt error notifications
Your virtual servers are the backbone of your IT infrastructure. Malfunctions can not only paralyze business processes, but also lead to losses in sales. For each measurement point, PRTG lets you define a threshold value which, when reached, will immediately trigger an alarm. You can choose to be alerted by email, SMS, or push notification. Thanks to the PRTG alarm system, you’ll usually have time to intervene before errors occur and your coworkers start lining up outside your door. With the PRTG Server Monitoring Tool, you’ll keep downtime to a minimum.
Preconfigured sensors for monitoring virtual servers
![]() How PRTG defines sensors
How PRTG defines sensors
In PRTG, “sensors” are the basic monitoring elements. One sensor usually monitors one measured value in your network, e.g. the traffic of a switch port, the CPU load of a server, the free space of a disk drive. On average you need about 5-10 sensors per device or one sensor per switch port.
PRTG comes with preconfigured sensors to allow for fast and easy setup. With just a few clicks, you can add your virtual servers to PRTG and get started with your monitoring. Once your virtual environment is added to PRTG, you'll immediately begin to receive all the key data regarding your hosts, virtual machines, and applications. Neatly arranged dashboards and custom maps ensure you constantly get the information you need.
![]()
Citrix XenServer Virtual Machine Sensor
This sensor monitors a virtual machine on a Citrix XenServer. It displays CPU and memory usage, the read and write speeds of hard drives, and the network transmission rate of an individual virtual machine.
![]()
VMware Host Hardware (WBEM) Sensor
The PRTG VMware Host Hardware (WBEM) Sensor can monitor the performance of ESX/ESXi. It displays the temperature, current power consumption, fan speed, battery voltage, and health status of the host server.
![]()
Hyper-V Virtual Network Adapter Sensor
The Hyper-V Virtual Network Adapter Sensor uses WMI or Windows performance counters to monitor virtual network adapters running on a Microsoft Hyper-V server.
Click here for a full list of all PRTG virtual server sensors
Virtual server sensors in detail
Vendor/Product | Sensor | Description |
| Citrix XenServer Host | Citrix XenServer Host Sensor | Monitors a Xen host server via HTTP. It can show:
|
| Citrix XenServer Virtual Machine | Citrix XenServer Virtual Machine Sensor | Monitors a virtual machine on a Xen server via HTTP. It can show:
|
| Docker Container | Docker Container Status Sensor | Monitors the status of a Docker container. It can show among others.:
|
| HP StorageWorks Enterprise Virtual Array | Enterprise Virtual Array Sensor | Monitors an HP EVA using ssu.exe and can show among others.:
|
| Hyper-V Cluster | Hyper-V Cluster Shared Volume Disk Free Sensor | It can show:
|
| Hyper-V Host Server | Hyper-V Host Server Sensor | Monitors a Hyper-V cluster shared volume via PowerShell. It can show:
|
| Hyper-V Virtual Network Adapter | Hyper-V Virtual Network Adapter Sensor | Monitors virtual network adapters running on a Hyper-V host server via WMI or Windows Performance Counters. It can show:
|
| Hyper-V Virtual Machine | Hyper-V Virtual Machine Sensor | Monitors VM via WMI or Windows Performance Counters. It can show:
|
| VMware Data Store | VMware Datastore (SOAP) Sensor | Monitors the disk usage of a Vmware data store using SOAP. It can show:
|
| VMware Host | VMware Host Hardware (WBEM) Sensor | Monitors hardware information of an ESX/ESXi server using WBEM. It can show:
|
| VMware Host Hardware Status (SOAP) Sensor | Provides a general status overview for the host and shows the total number of items in normal, warning, and alter status. | |
| VMware Host Performance (SOAP) Sensor | Monitors a VMware host server using SOAP and can show among others:
| |
| VMware Virtual Machine | VMware Virtual Machine (SOAP) Sensor | Monitors a VM on a VMware host server using SOAP and can show others.:
|
PRTG makes your job easier
Our monitoring software frees you to focus on other tasks by promptly notifying you of potential issues.
![]()
Save effort
PRTG gives you one central monitoring tool for your servers and entire network. Enjoy a quick overview of your whole infrastructure via our dashboard and app.
![]()
Save time
Getting started with PRTG is a breeze. Setting up or switching from another network monitoring tool is easy thanks to the auto-discovery and pre-configured device templates.
![]()
Save money
80% of our customers report substantial cost savings with network monitoring. Your costs of licenses will likely pay for themselves within weeks.

“The greatest advantage of PRTG? You get to rest easy.“
Steffen Ille, Bauhaus-University of Weimar, Germany
Trusted by 500,000 users and recognized
by industry analysts as a leader

“Fantastic network and infrastructure monitoring solution that is easy to deploy and easier still to use. Simply the best available.”

“Software is absolutely perfect, Support is superior. Meets all needs and requirements, this is a must have solution if you are needing any form of monitoring.”

“The tool excels at its primary focus of being a unified infrastructure management and network monitoring service.”
“Easy to implement and configure with good technical support.”
R. v. S., ICT Manager at Heinen & Hopman Eng BV
PRTG works with all big manufacturers
PRTG lets you monitor the virtual servers of all the major manufacturers. It can monitor the virtual environments of VMware, Hyper-V, Citrix, and Amazon EC2, among others.
Do you want to monitor virtual desktops? See this knowledge base article for more information about virtual desktop monitoring with PRTG.

PRTG is a VMware Certified Technology Partner
Paessler PRTG has achieved VMware's highest level of endorsement due to our technological excellence, leading market position, and superior compatibility with VMware products.
As a member of the VMware Technology Alliance Program, our software has passed VMware's testing and review process and works effectively with VMware infrastructure.
But what does this mean for you? It means we have the expert insight to deliver the best VMware monitoring experience in the world.
In fact, we use VMware for our own environments every day. This gives us a deep understanding of an administrator's problems and needs so we can provide intuitive, easy-to-use VMware monitoring.
PRTG features a variety of alert types: E-mail, SMS, Pager, Apps, running an external application, etc. You can specify when and how each person is to be informed about network issues. To do so, you can add contacts and edit, delete, or pause your notifications at any time. The notification system is built into the monitoring software and is available at no extra charge. Because of its integrated quality, configuring the alert feature is done in just a few clicks. PRTG won't wait to let you know if your "house is on fire." You define your own thresholds. If these are crossed, you'll receive a corresponding notification. This means you can intervene promptly before clients or coworkers are aware of any problems. Notification system:
Be alerted quickly![]()
Flexible
![]()
Integrated
![]()
Proactive

“Hey Dieter, what kind of advice would you give to an administrator who wants to monitor VMware with PRTG?”
“I'd use both our VMware VM sensors as well as vSphere host and environment sensors. If there are problems with the host, then the virtual services are also affected.”
Dieter Loskarn, sensor development for Paessler AG


White paper: Why you should consider server virtualization
In our white paper you get all the facts about server virtualization and network management.
Get your free copy of our white paper now.

PRTG: The multi-tool for sysadmins
Adapt PRTG individually and dynamically to your needs and rely on a strong API:- HTTP API: Access monitoring data and manipulate monitoring objects via HTTP requests
- Custom sensors: Create your own PRTG sensors for customized monitoring
- Custom notifications: Create your own notifications and send action triggers to external systems
- REST Custom sensor: Monitor almost everything that provides data in XML or JSON format
Still not convinced?
![]()
More than 500,000 sysadmins love PRTG
Paessler PRTG is used by companies of all sizes. Sysadmins love PRTG because it makes their job a whole lot easier.
Still not convinced?
![]()
Monitor your entire IT infrastructure
Bandwidth, servers, virtual environments, websites, VoIP services – PRTG keeps an eye on your entire network.
![]()
Try Paessler PRTG for free
Everyone has different monitoring needs. That’s why we let you try PRTG for free. Start now with your trial.
|
PRTG |
Network Monitoring Software - Version 24.2.94.1400 (April 10th, 2024) |
|
Hosting |
Download for Windows and cloud-based version PRTG Hosted Monitor available |
Languages |
English, German, Spanish, French, Portuguese, Dutch, Russian, Japanese, and Simplified Chinese |
Pricing |
Up to 100 sensors for free (Price List) |
Unified Monitoring |
Network devices, bandwidth, servers, applications, virtual environments, remote systems, IoT, and more |
Supported Vendors & Applications |
|
Combining the broad monitoring feature set of PRTG with IP Fabric’s automated network assurance creates a new level of network visibility and reliability.