![]()
PRTG monitors your company’s
network usage in real time

PRTG monitors devices,
applications, and bandwidth
PRTG sounds the alarm when network loads get too high
PRTG comes with a dashboard so you can quickly check the status of your network
Monitor network usage with PRTG
Jump to the topic of your choice
- Network usage: Less is better? Two case scenarios
- Sensors for measuring network activity
- 3 good reasons to go with PRTG
- Network utilization tools: An overview
- Dealing with network load problems? Monitoring vs. analysis
- Backups – a common source of network problems
- 3 tips for optimizing network performance
- ROI: Calculate the return on investment of your network monitoring tool
Network usage: Less is better? Two case scenarios
Increasing network usage
A medium-sized company has a great deal of bandwidth. Nevertheless, its download speeds are slow. Its network load is too low, and its available bandwidth is not being put to optimal use. The sysadmin hopes to find the bottleneck. He uses PRTG SNMP sensors to monitor the hardware in his firm. The result: he discovers an old switch that is malfunctioning because of several missed updates. After the updates, network usage rises considerably.
Reducing network usage
The network in a large organization has been at full capacity for several months. Overloads are now everyday occurrences. The network is distributed across several locations throughout the city. The IT team goes about finding ways to reduce the network load. They use the PRTG Packet Sniffer Sensor and Flow sensors to determine the amount of bandwidth being used by the network’s devices and applications. Their conclusion: new software in one of the firm’s departments was configured incorrectly and causing the overload.
Sensors for measuring network activity
![]() How PRTG defines sensors
How PRTG defines sensors
In PRTG, “sensors” are the basic monitoring elements. One sensor usually monitors one measured value in your network, e.g. the traffic of a switch port, the CPU load of a server, the free space of a disk drive. On average you need about 5-10 sensors per device or one sensor per switch port.
![]()
Measuring bandwidth
The SNMP Traffic Sensor lets you see the speed at which data is flowing through your network. This includes both incoming and outgoing traffic. Your dashboard provides you with a constant overview of the amount of bandwidth being consumed. In the event of problems, PRTG notifies you at once.
![]()
Protocols, data types, IP addresses
You can use the Packet Sniffer Sensor and NetFlow sensors to filter your data traffic. As a result, you'll get an in-depth look at the load values of your network. Protocols, data types, and IP addresses are displayed on easy-to-read dashboards. You therefore get a clear overview of your network’s top talkers, as well as other important values. PRTG also comes with sensors for Flow technologies such as IPFIX.
3 good reasons to go with PRTG
![]()
PRTG lets you leave your work at the office
With PRTG running in the background, you can sit back and relax knowing all is OK. Otherwise the PRTG alarm - which you configured yourself - would have already notified you that something is wrong. Go home relaxed, enjoy the weekend, and unplug completely while on vacation. PRTG gives you real peace of mind. And that’s priceless.
![]()
PRTG allows for swift troubleshooting
Thanks to the PRTG dashboard, you can immediately recognize even the smallest of problems. You’ll be like an eagle who sees a mouse from hundreds of feet away – and already on the floor tightening the screws on the server before your coworkers have a chance to put down their coffee and call the support line.
![]()
With PRTG, your network stays fit as a fiddle
Everything ages – including your network. But unfortunately, your network doesn’t always look its age. Luckily, you have PRTG. PRTG lets you run long-term analyses. It will show you which routers and switches are ailing and in need of rejuvenation. Your network thus stays fit and trim well into the future – and you can save yourself some wrinkles.
A sneak peek into network usage monitoring with PRTG
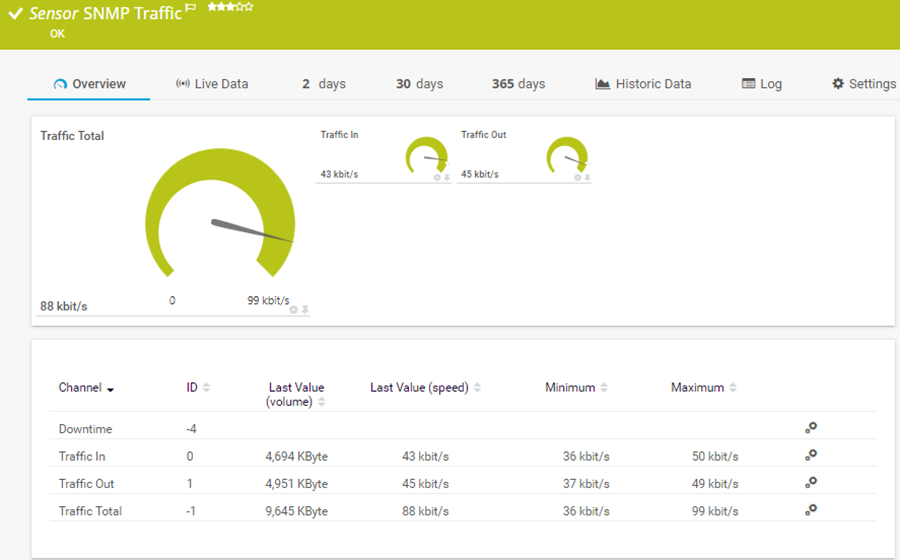
SNMP data traffic
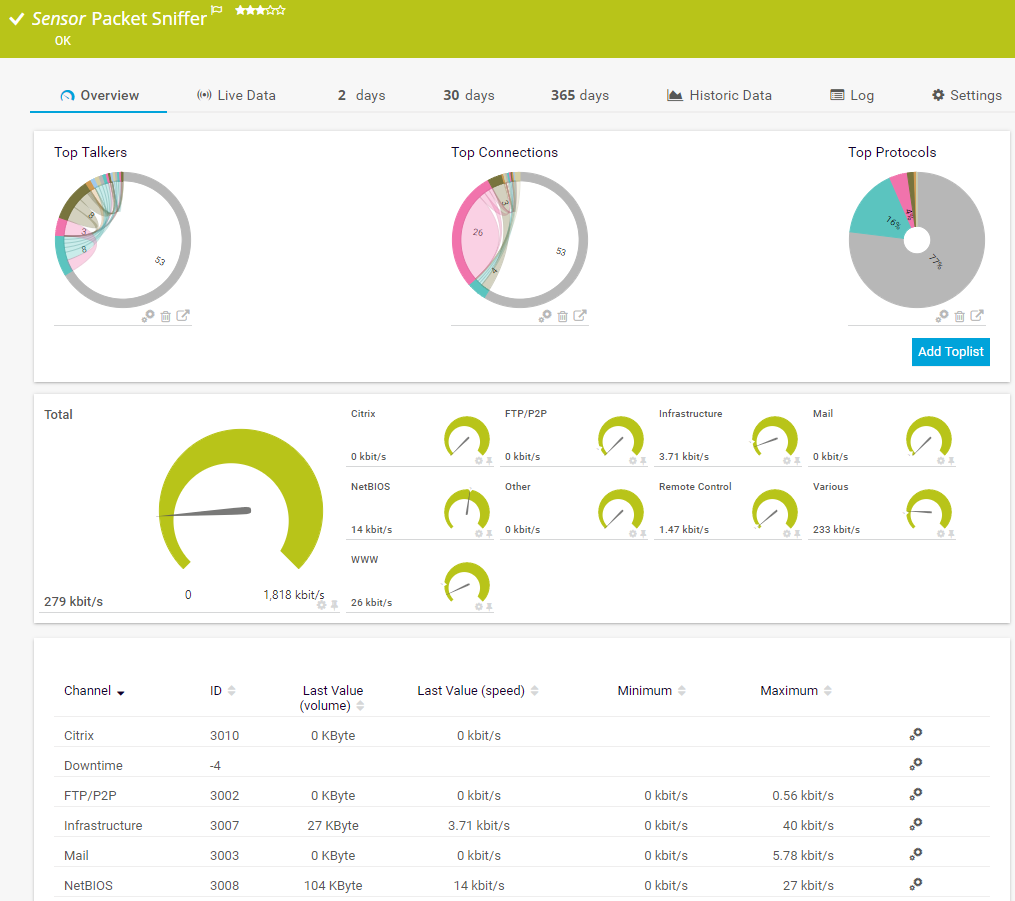
Packet Sniffer Sensor

PRTG "Sunburst" view
Network utilization tools: An overview
![]()
Free Windows monitoring tools
Open source software (such as Nagios) is easy to find. At first glance, these free tools appear to be cost-effective. But that’s not taking into account the extra time required for their configuration. Post-installation modifications are also extremely time-consuming. We’ve put Nagios to the test. See our comparison of Nagios vs. PRTG. Windows itself also comes with free monitoring tools. But these tools are rather limited in scope. They will allow you as a sysadmin to check individual aspects of your network, but are unable to provide easy-to-understand monitoring data for the other employees in your company.
![]()
Professional tools like PRTG
Hardware, software, applications: PRTG monitors each and every part of your network. PRTG is a professional tool used by more than 500,000 administrators worldwide. No wonder: PRTG takes just minutes to set up. The alarm feature is included, and our technical support department provides quick answers to nearly every question you might have. This of course comes with a price – one that is easy to justify when you consider all the time you will save.
Dealing with network load problems? Monitoring vs. analysis
Network load monitoring
PRTG is a network monitoring tool that provides you with a quick overview. It therefore enables you to promptly and conveniently eliminate potential sources of error – e.g. by analyzing individual data packets. Thanks to PRTG toplists, you can spot top talkers and top connections. You cannot, however, analyze the content of individual files.
Analysis of individual files
Tools such as Wireshark and other software allow you to perform detailed and extensive network analyses. In the event of more serious network usage problems, you’ll probably need a combination of several tools to get to the root of the problem. Read how PRTG can help with network analyses, and where its limits lie.
Backups – a common source of network problems
![]()
Network problems seem to always crop up during backups. PRTG helps you determine the network load during backups, and identify the causes of any problems which may arise. Example: Many companies and organizations use a variety of different backup tools. But when all these tools are launched at the same time, the network tends to overload.

Practical tip: “Hey Mathias, what would you tell administrators who wish to monitor their bandwidth?”
“Instead of trying to measure bandwidth by way of an extra, simulated load, you should have a look around for actions which do that anyway – and then monitor them. For example, when you perform backups, you often put great strain on the bandwidth and can thus easily recognize shortages or bottlenecks.”
Mathias Hengl, PRTG developer at Paessler AG
Trusted by 500,000 users and recognized
by industry analysts as a leader

“Fantastic network and infrastructure monitoring solution that is easy to deploy and easier still to use. Simply the best available.”

“Software is absolutely perfect, Support is superior. Meets all needs and requirements, this is a must have solution if you are needing any form of monitoring.”

“The tool excels at its primary focus of being a unified infrastructure management and network monitoring service.”
3 tips for optimizing network performance
![]()
Regularly eliminate bottlenecks
Bottlenecks are present in all large networks. Most of the time, the IT department even knows that they are there. But usually there is not enough time in the workday to go about eliminating them. That’s where PRTG comes in. Its built-in alarm system immediately notifies you in the event of a bottleneck, thus allowing you to quickly proceed with its elimination. The time you save can be used for fixing other bugs and problems.
![]()
Load up on bandwidth
The most effective method for optimizing network performance is to increase your bandwidth. This of course costs money, but also results in considerably fewer crashes. During downtime, employees are unproductive. Customer inquiries cannot be answered, and the company risks losses in sales. Don’t underestimate the cost of downtime. We at Paessler have increased the capacities of our data lines to ensure our processes are always up and running.
![]()
Get rid of outdated hardware
Network problems may also be caused by outdated hardware. This hardware not only includes old routers and switches, but also poorly performing servers. PRTG lets you identify these obstacles. Its built-in reporting function generates easy-to-read charts and graphs which also allow department heads to ascertain where improvements must be made. PRTG therefore helps you to optimize the performance of your network.
ROI: Calculate the return on investment of your network monitoring tool
![]()
In this white paper, we'll show you how to calculate your ROI when purchasing network monitoring software. Use the information in this paper to calculate the financial impact of downtime due to high network loads, as well as the benefit provided by perfect uptime.
Keep a constant eye on your network – even while on the go
Set up PRTG in minutes and use it on almost any mobile device.


Other topics
Quality of service
Does your network suffer from packet loss? Your coworkers complain because the VoIP is down and their video calls keep failing? PRTG is the perfect tool for monitoring quality of service. It keeps a constant eye on jitter, latency, and your MOS.
Windows performance counters
There are a number of different possibilities for monitoring Window systems. The most common one is Windows Management Instrumentation (WMI). Compared to other technologies, however, WMI requires a great deal of the network’s load. Windows performance counters can be used as an alternative to WMI. Find out more about Windows performance counters.
CDN monitoring
The websites of international companies are accessed by users from all over the world – not just customers but also suppliers and employees. Many IT teams set up content delivery networks (CDNs) to ensure their network performance does not drop. PRTG lets you monitor these CDNs. Learn more about CDN monitoring.
Create innovative solutions with Paessler’s partners
Partnering with innovative vendors, Paessler unleashes synergies to create
new and additional benefits for joined customers.


UVnetworks
UVexplorer integrates tightly with PRTG to bring fast and accurate network discovery, detailed device inventory, and automatic network mapping to the PRTG platform.
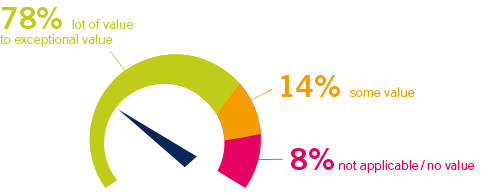
We asked: would you recommend PRTG?
Over 95% of our customers say yes!
Paessler AG conducted trials in over 600 IT departments worldwide to tune its network monitoring software closer to the needs of sysadmins.
The result of the survey: over 95% of the participants would recommend PRTG – or already have.

![]()
“We can all work with greater peace of mind knowing
that our systems are constantly being monitored.”
Markus Puke, Network Administrator, Schüchtermann Klinik, Germany
PRTG is worth it: You’ll optimize your entire IT!
The costs for a one-year PRTG license usually pay for themselves within a few weeks.
PRTG makes your network more reliable
PRTG saves network management costs
PRTG saves time spent on network management
“Easy to implement and configure with good technical support.”
R. v. S., ICT Manager at Heinen & Hopman Eng BV

PRTG: The multi-tool for sysadmins
Adapt PRTG individually and dynamically to your needs and rely on a strong API:- HTTP API: Access monitoring data and manipulate monitoring objects via HTTP requests
- Custom sensors: Create your own PRTG sensors for customized monitoring
- Custom notifications: Create your own notifications and send action triggers to external systems
- REST Custom sensor: Monitor almost everything that provides data in XML or JSON format
Still not convinced?
![]()
More than 500,000 sysadmins love PRTG
Paessler PRTG is used by companies of all sizes. Sysadmins love PRTG because it makes their job a whole lot easier.
Still not convinced?
![]()
Monitor your entire IT infrastructure
Bandwidth, servers, virtual environments, websites, VoIP services – PRTG keeps an eye on your entire network.
![]()
Try Paessler PRTG for free
Everyone has different monitoring needs. That’s why we let you try PRTG for free. Start now with your trial.
|
PRTG |
Network Monitoring Software - Version 24.2.94.1400 (April 10th, 2024) |
|
Hosting |
Download for Windows and cloud-based version PRTG Hosted Monitor available |
Languages |
English, German, Spanish, French, Portuguese, Dutch, Russian, Japanese, and Simplified Chinese |
Pricing |
Up to 100 sensors for free (Price List) |
Unified Monitoring |
Network devices, bandwidth, servers, applications, virtual environments, remote systems, IoT, and more |
Supported Vendors & Applications |
|