Custom alerts and data visualization let you quickly identify and prevent performance issues.
Paessler PRTG is your all-in-one monitoring software that also collects data from your routers round the clock to avoid overloads that slow down your company's communication and workflow.
Diagnose network issues by continuously tracking the availability, health, and performance of your routers. Show response time, CPU usage, memory, bandwidth usage, router traffic, and other performance metrics in real time. Visualize monitoring data in clear graphs and dashboards to identify problems more easily. Gain the overview you need to troubleshoot router issues and your entire network infrastructure.
Map of hardware monitoring in PRTG

Device tree view of the complete monitoring setup

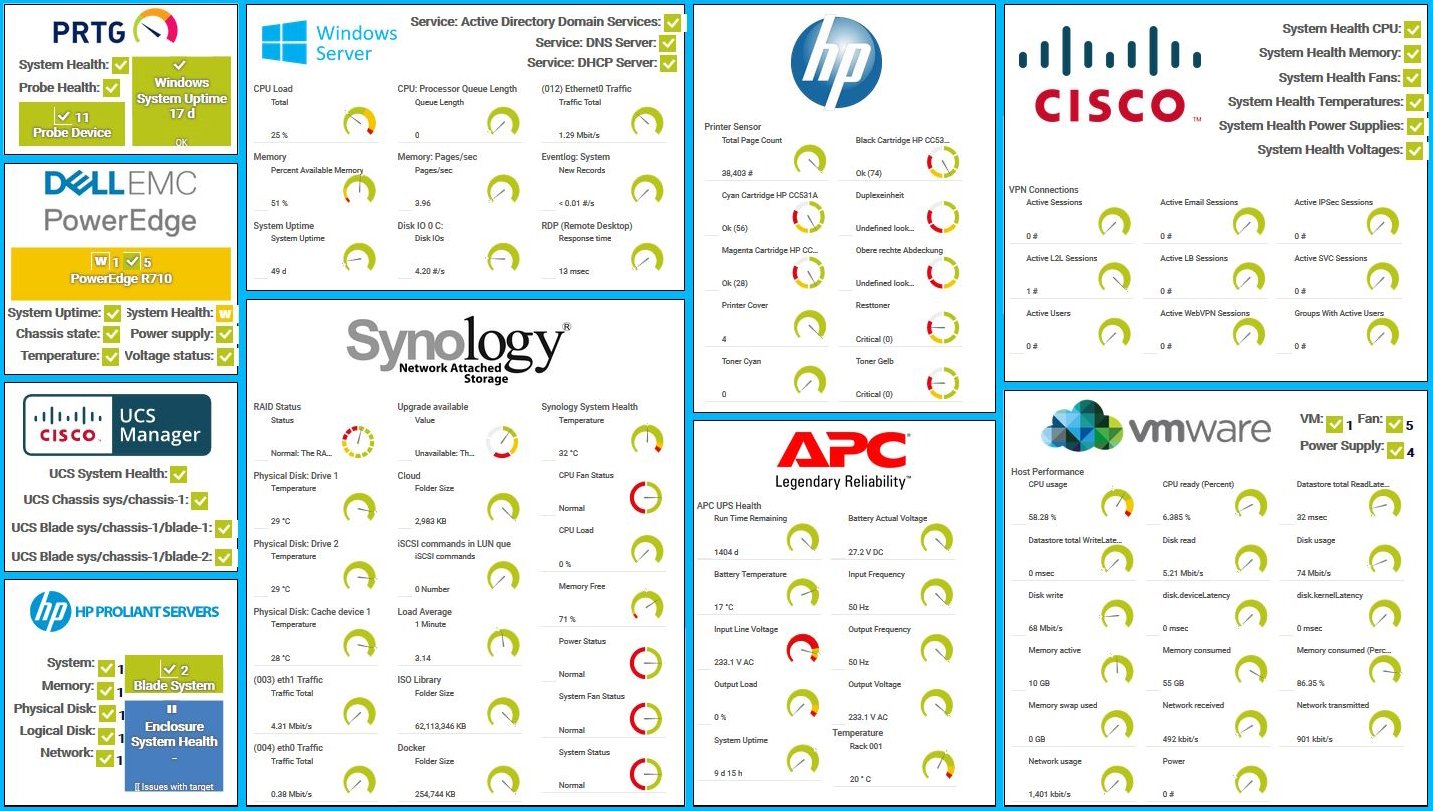
Custom PRTG dashboard for keeping an eye on the entire IT infrastructure

Live traffic data graph in PRTG
“All-around winning
network monitor”
“The real beauty of PRTG is the endless possibilities it offers”
“PRTG Network Monitor
is very hard to beat”
Use PRTG to see immediately when your routers are forwarding too much data so you can act before they become overloaded.
PRTG router monitoring provides automatic alerts when the network crashes or protocol errors take place so you can prevent major issues and fix issues as fast as possible. Receive custom notifications, for example via SMS, email, or in-app push notification.
Create more stable connections by adjusting available bandwidth to meet demand and reduce unnecessary traffic. Your company's operations can run faster with optimized bandwidth, which also increases the availability of services and applications.
Visualized dashboards let you analyze the intensity of traffic across individual connections. Detect suspicious traffic – often indicative of malware – to keep your company secure and free from network attacks such as DDoS or botnets.
PRTG comes with more than 250 native sensor types for monitoring your entire on-premises, cloud, and hybrid cloud environment out of the box. Check out some examples below!
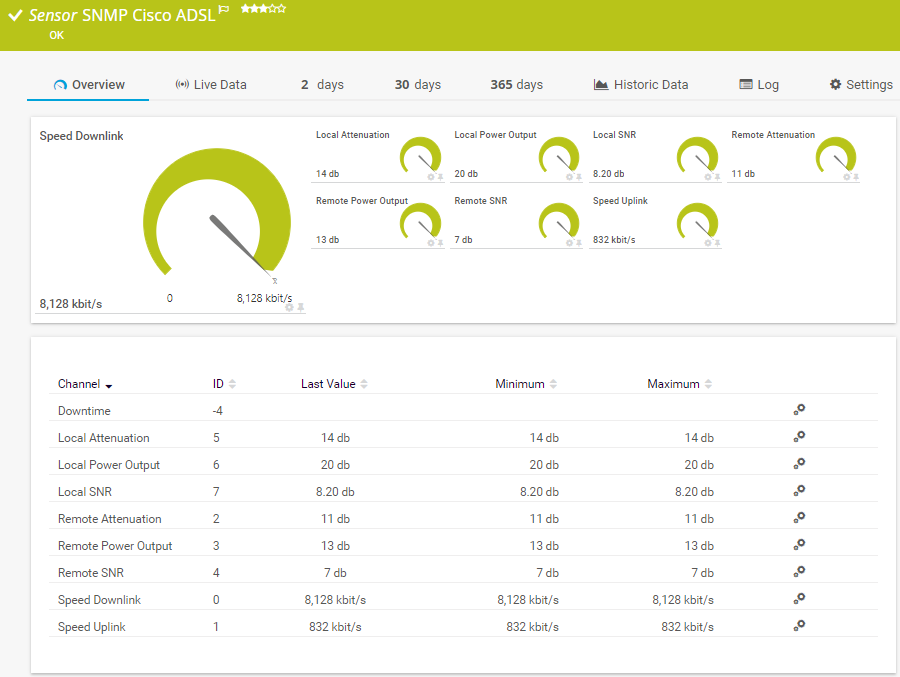
The SNMP Cisco ADSL sensor monitors asymmetric digital subscriber line (ADSL) statistics of a Cisco router. It can show the following:
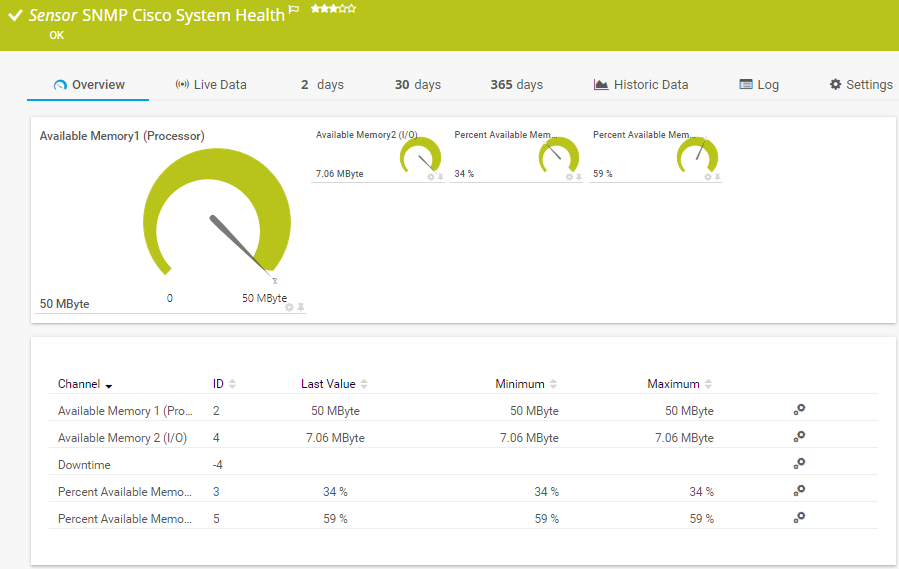
The SNMP Cisco System Health sensor monitors the system health of a Cisco device. It can show the following:
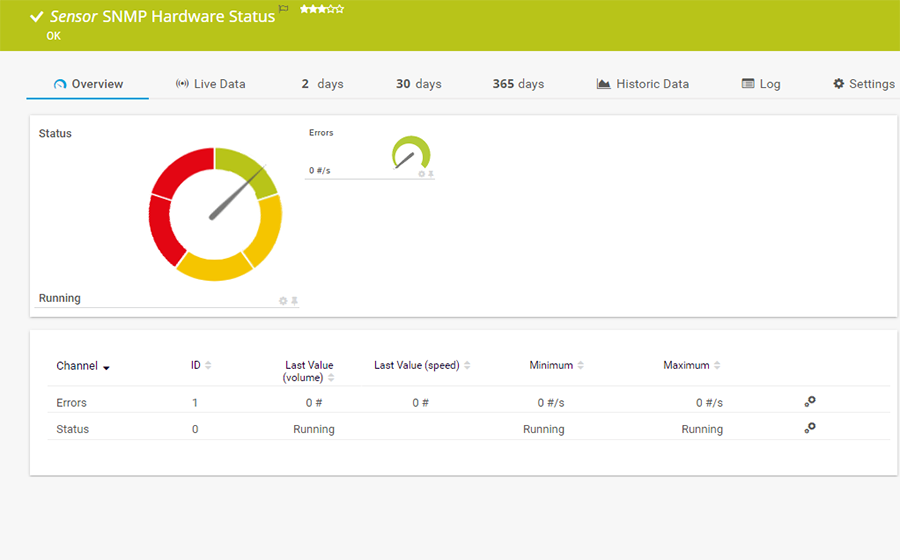
The SNMP Hardware Status sensor monitors the status of a server's hardware component. It can show the following:
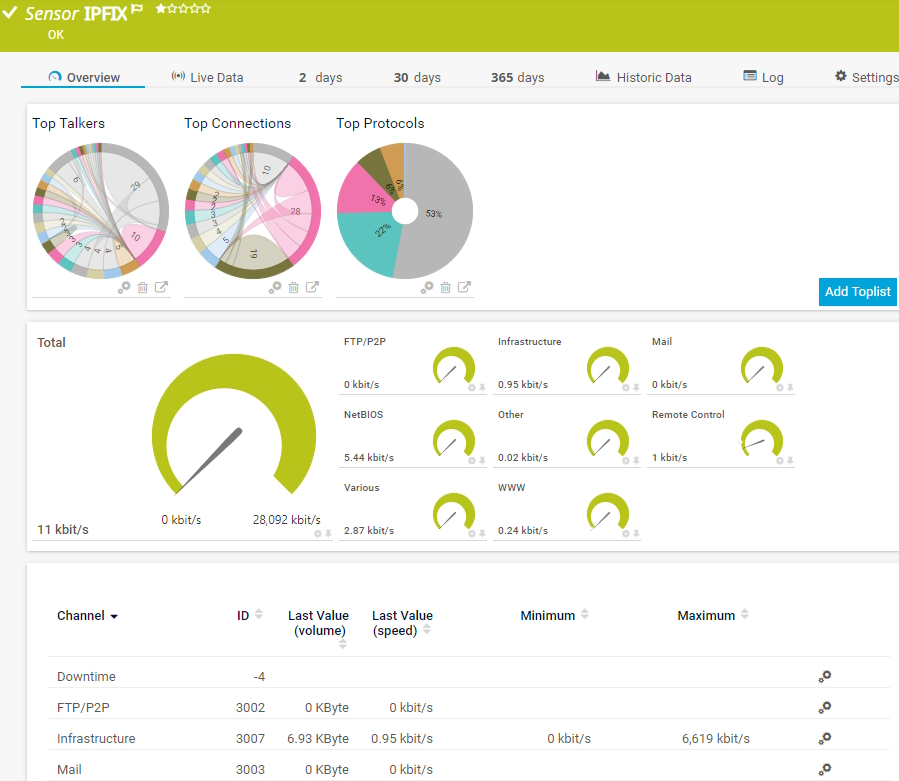
The IPFIX sensor receives traffic data from an Internet Protocol Flow Information Export (IPFIX) compatible device and shows traffic by type. It can show the following and more:
See the PRTG Manual for a list of all available sensor types.
Real-time notifications mean faster troubleshooting so that you can act before more serious issues occur.

As your router management software PRTG integrates with routers from all major manufacturers like Cisco, Dell, Yamaha, Linksys, TP Link, and Netgear. Its preconfigured sensors use various technologies to keep an eye on the availability, health, and performance of your routers.
SNMP is the easiest way to measure hardware parameters or calculate traffic keeping CPU and network loads low. Use, for example, the following sensors:
The Packet Sniffer sensor monitors the headers of data packets that pass a local network card using a built-in packet sniffer. With router monitoring you can break down traffic by IP address or protocol, and choose from predefined channels, for example:
The NetFlow v5, NetFlow v9, sFlow, and jFlow v5 sensors receive traffic data from a compatible device and show the traffic by type. These sensors have several filter options to divide traffic into different channels for example:
Custom alerts and data visualization let you quickly identify and prevent router performance issues.
PRTG is set up in a matter of minutes and can be used on a wide variety of mobile devices.

As a member of the Cisco Partner Program, Paessler is one of the market leaders that enhances the Cisco technology portfolio with products that are proven to easily integrate with Cisco devices.
What does this mean for you?
Partnering with innovative IT vendors, Paessler unleashes synergies to create
new and additional benefits for joined customers.
baramundi and PRTG create a secure, reliable and powerful IT infrastructure where you have everything under control - from the traffic in your firewall to the configuration of your clients.
With the combination of PRTG and Insys, the monitoring specialist Paessler and the industrial gateway manufacturer INSYS icom offer a practical possibility to merge IT and OT.
Siemon and Paessler bring together intelligent building technology and advanced monitoring and make your vision of intelligent buildings and data centers become reality.
Real-time notifications mean faster troubleshooting so that you can act before more serious issues occur.
Network Monitoring Software – Version 26.1.116.1532 (February 9th, 2026)
Download for Windows and cloud-based version PRTG Hosted Monitor available
English, German, Spanish, French, Portuguese, Dutch, Russian, Japanese, and Simplified Chinese
Network devices, bandwidth, servers, applications, virtual environments, remote systems, IoT, and more
Choose the PRTG Network Monitor subscription that's best for you


Router monitoring is the process of tracking and analyzing the performance, health, and security of network routers. This practice is essential for ensuring network reliability, optimal performance, and security. Paessler PRTG is your comprehensive network monitoring tool that also keeps an eye on your routers and other network devices.
Router monitoring typically involves the following components:
Performance monitoring
Health monitoring
Security monitoring
Configuration monitoring
Benefits of router monitoring include:
In PRTG, “sensors” are the basic monitoring elements. One sensor usually monitors one measured value in your network, for example the traffic of a switch port, the CPU load of a server, or the free space on a disk drive. On average, you need about 5-10 sensors per device or one sensor per switch port.
Paessler conducted trials in over 600 IT departments worldwide to tune its network monitoring software closer to the needs of sysadmins. The result of the survey: over 95% of the participants would recommend PRTG – or already have.

Paessler PRTG is used by companies of all sizes. Sysadmins love PRTG because it makes their job a whole lot easier.
Bandwidth, servers, virtual environments, websites, VoIP services – PRTG keeps an eye on your entire network.
Everyone has different monitoring needs. That’s why we let you try PRTG for free.