![]()
Watch your data center 24/7 with PRTG
- Get a comprehensive overview of your data center
- Increase application performance & avoid traffic bottlenecks
- Monitor environmental parameters in your data center
- Use resources efficiently and upgrade only if needed
Our users give top ratings for monitoring with Paessler PRTG


Data center monitoring with PRTG
- Why choose our data center monitoring tool PRTG?
- 4 reasons why our PRTG data center monitor is the best fit for you
- Monitor all aspects of your data center
- Discover our preconfigured PRTG data center monitoring sensors
- More than just a data center monitoring software: PRTG is the only network monitoring tool you need
- Data center monitoring: FAQ
PRTG makes data center monitoring easy
Custom alerts and data visualization make it easy to monitor, identify, and prevent data center issues and outages.
Why choose our data center monitoring tool PRTG?
Data centers are at the heart of every IT infrastructure and mission critical in every company.
The infrastructure of most data centers is composed of heterogeneous devices, applications, and services from different manufactures and providers. To keep an overview of all these aspects is no easy task for sysadmins.
Our PRTG data center monitoring solution helps with this task and makes sure that your data center works just fine.
- Ensure 24/7 monitoring of your entire data center
- Check data center performance in real time
- Avoid downtimes and expensive outages
- Troubleshoot bottlenecks before they cause problems
- Analyze historical data for better capacity planning
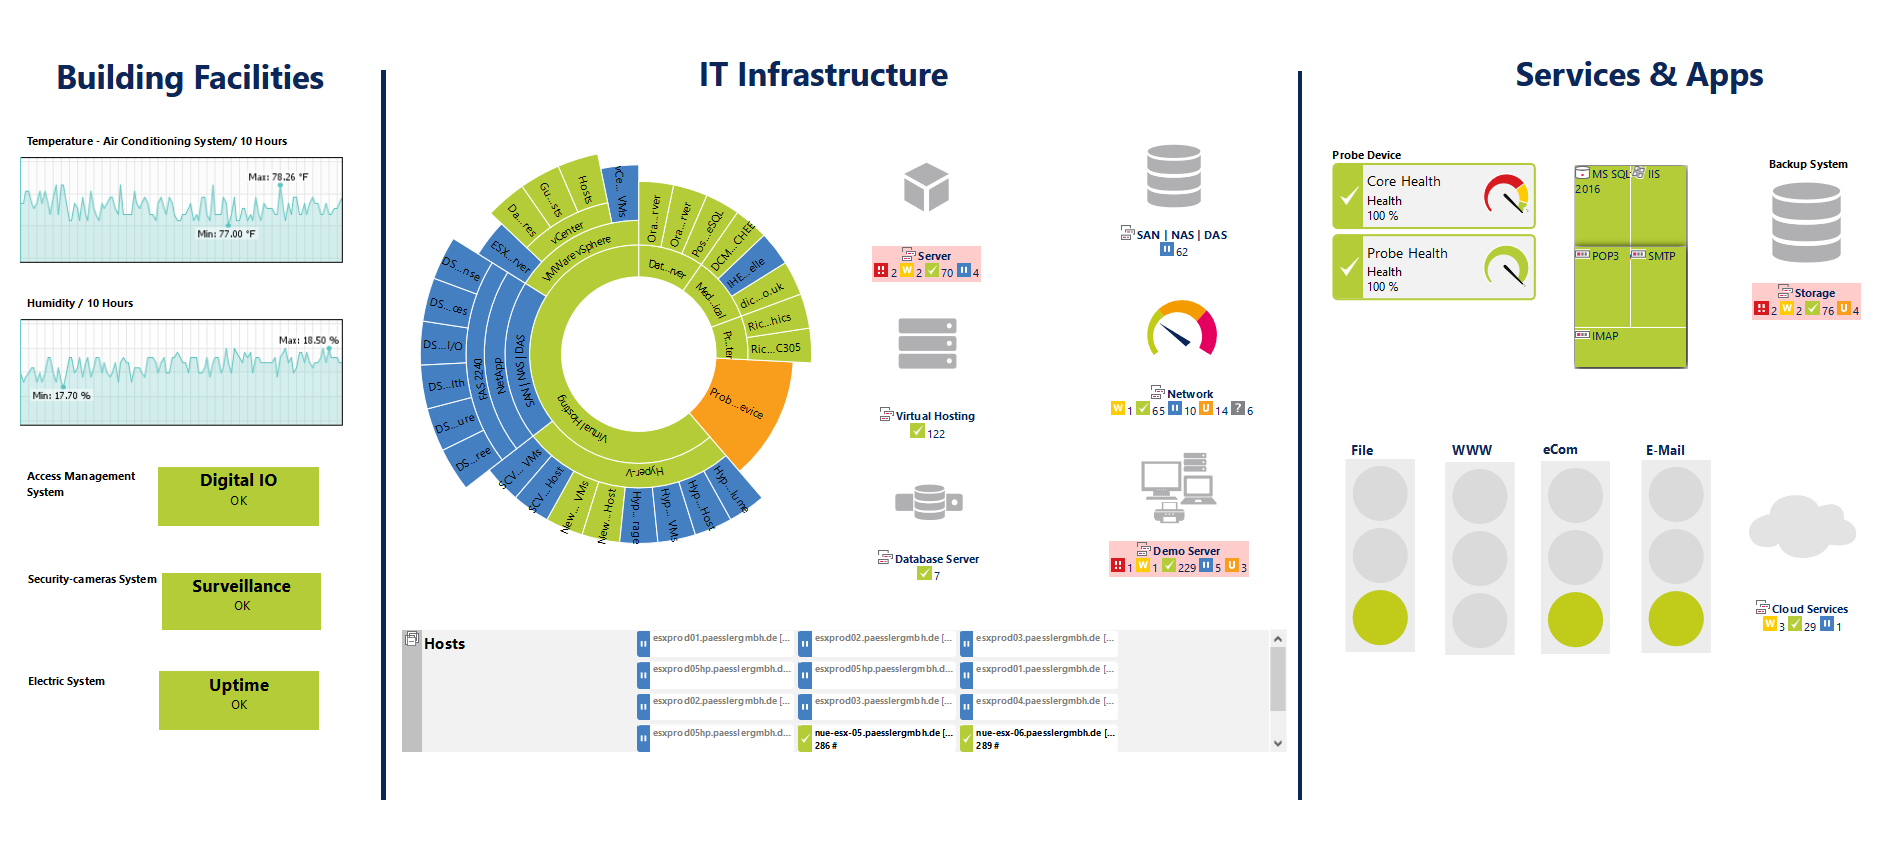
What data center monitoring looks like in PRTG
Diagnose network issues caused by errors in your data center by continuous data center monitoring. Show availability and performance in real time and visualize data in graphic maps & dashboards to identify problems more easily. Gain the visibility you need to troubleshoot data center issues.
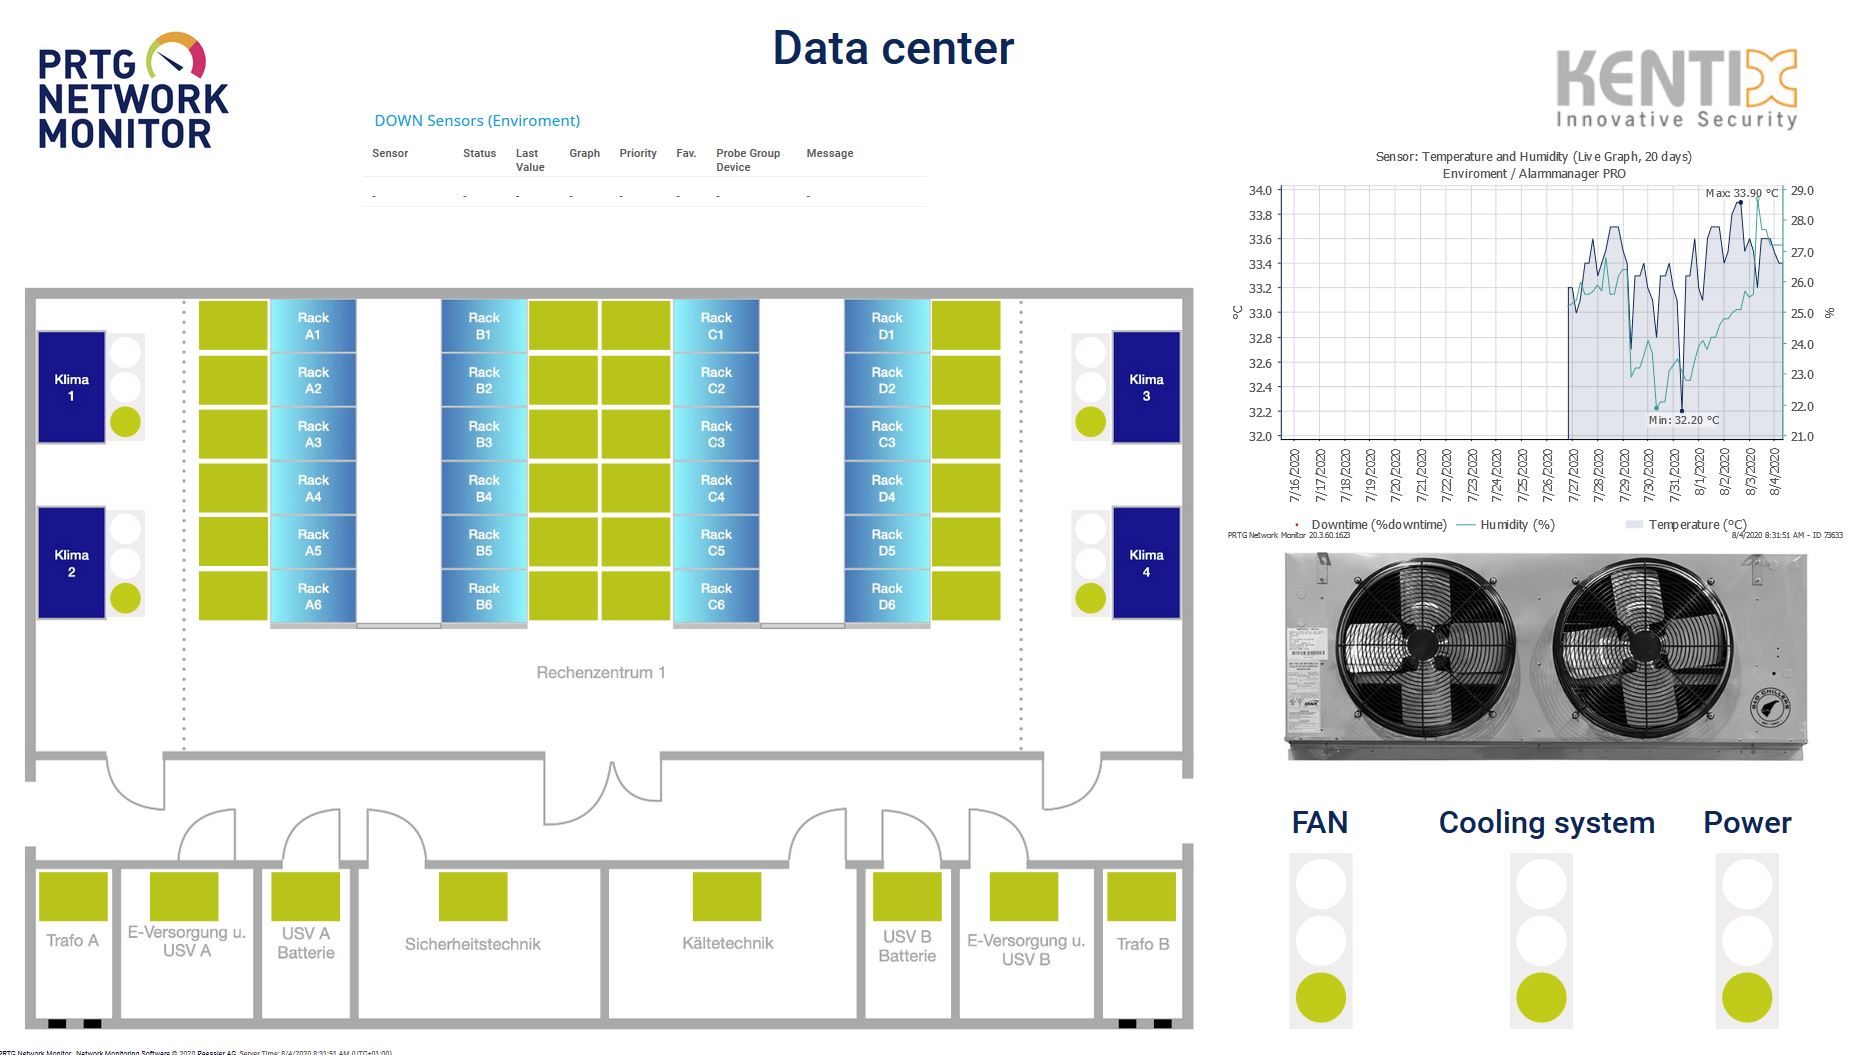
Custom Kentix data center dashboard
Dashboard displaying different data center monitoring aspects
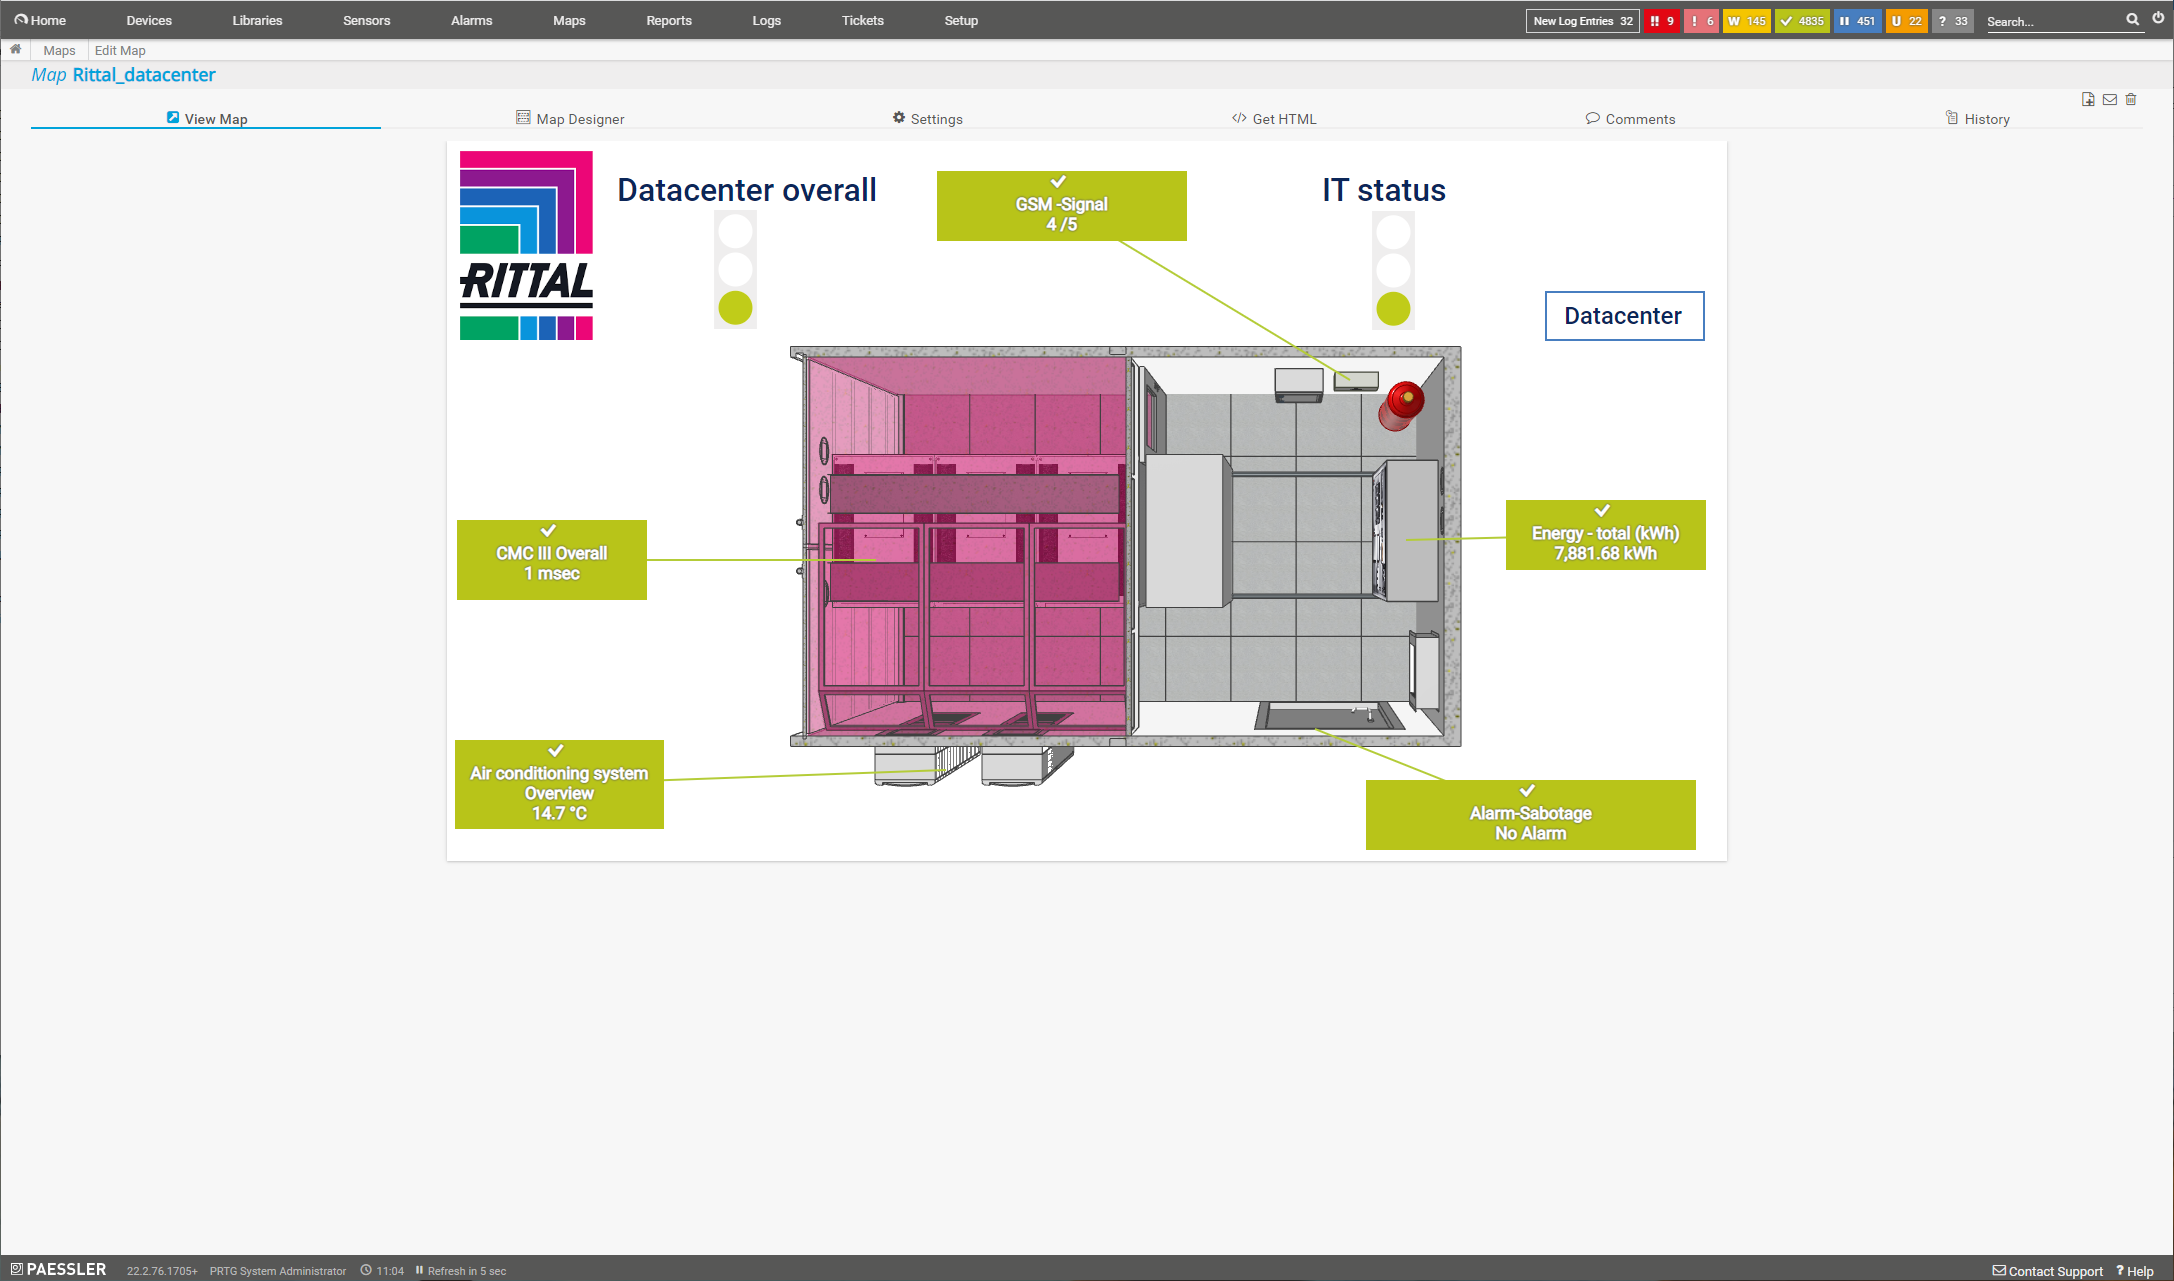
Monitoring a data center with Rittal and PRTG
Start data center monitoring with PRTG and see how it can make your network more reliable and your job easier.
PRTG is compatible with all major vendors, products, and systems
![]()
4 reasons why our PRTG data center monitor is the best fit for you
Avoid downtime with 24/7 data center monitoring
Everything in your data center is running smoothly? Great! In Paessler PRTG, you can see at one glance that there are no problems in your data center and focus on other areas of your work.
Every minute of downtime in your data center can cost your company thousands of dollars. Thus, high availability of all your data center components is vital for your business success.
What’s more: with PRTG, you can prevent errors and downtimes even before they occur. If a component in your data center infrastructure fails, PRTG shows you the cause of the error so that you can quickly fix it.
Customize thresholds, alerts & notifications
Once you have set up your data center monitoring in PRTG, you can sit back and relax. If any issue or error occurs in your data center, PRTG instantly alerts you via highly customizable alerts and notifications. You can not only set custom threshold values but also choose the way you want to be informed – whether by email, SMS, push notification, Teams or slack message, and more.
Visualize your data on structured maps & dashboards
The more complex your data center, the harder it is to know if everything works as expected. PRTG provides you with a central overview that consolidates any data center monitoring data in easy-to-read dashboards. You can also create your own, customized maps and dashboards that show you all important metrics in one view – even of distributed data centers.
Get detailed statistics and useful reporting
PRTG not only monitors your data center in real time but also records all important performance data. You therefore get detailed information about your data center whenever you want it: How high was the overall uptime during the last 12 months? What about bandwidth usage?
With the comprehensive reporting system of PRTG, you can also identify data usage trends in your data center. This way, you can decide more easily where more capacity is needed or where you can save resources. Data center monitoring reports help you to:
- Be proactive by detecting problems bevor they affect you customers
- Avoid downtime and costly system outages
- Fulfill your service level agreements (SLA)
- Provide better quality of experience to your customers
Monitor all aspects of your data center
Data centers are way more than a bunch of computers in a room. Thus, data center monitoring goes beyond traditional IT and network monitoring. In fact, a data center can be seen as an entity composed of three main blocks, which you can all monitor with PRTG.
Applications and services
Keep track of all applications and services which are hosted in your data center, for example, web servers (IIS, Apache), SQL servers (Microsoft SQL Server 2005-2016, Oracle, MySQL, PostgreSQL), mail servers (Exchange, IMAP, POP3, SMTP), web applications (websites, portals), backups, security, and customer specific applications.
![]()
Environmental parameters
Most data centers host critical information and run applications that businesses and individuals rely on for their daily work. As a result, it is crucial to maintain an optimal data center environment. This involves monitoring metrics such as temperature, humidity, smoke, the energy supply, and even physical security in server rooms.
“All-around winning “The real beauty of PRTG is the endless possibilities it offers” “Outstanding cloud IT experts agree: Paessler PRTG is a great solution for IT infrastructure monitoring

network monitor”

monitoring”
Easily find the source of the problem with our PRTG data center monitoring solution
Real-time alerts and custom notifications make it easy to solve issues with your data center.
Discover our preconfigured PRTG data center monitoring sensors
Here are some examples of sensors that can be used for data center monitoring with PRTG:
![]() How PRTG defines sensors
How PRTG defines sensors
In PRTG, “sensors” are the basic monitoring elements. One sensor usually monitors one measured value in your network, e.g. the traffic of a switch port, the CPU load of a server, the free space of a disk drive. On average you need about 5-10 sensors per device or one sensor per switch port.
SNMP Rittal CMC III Hardware Status
The SNMP Rittal CMC III Hardware Status sensor monitors the overall status of Rittal data center hardware, for example:
- Rittal CMC III processing units
- Rittal power distribution units (PDU)
- Rittal IoT interfaces
- Hardware status of every attached external sensor
SNMP APC Hardware
The SNMP APC Hardware sensor monitors performance counters on an APC UPS device. It can show, for example:
- Actual voltage of battery
- Capacity of battery
- Input and output voltage
- Remaining runtime of battery
- Temperature of battery
SNMP Poseidon Environment
The SNMP Poseidon Environment sensor monitors performance counters for environmental measurements on Poseidon hardware, for example:
- Temperature
- Humidity
Modbus RTU Custom
The Modbus RTU Custom sensor connects to a Modbus RTU server and monitors up to ten returned numeric values, for example:
- Temperature
- Humidity
Modbus TCP Custom
The Modbus TCP Custom sensor connects to a Modbus RTU server and monitors up to ten returned numeric values, for example:
- Voltage
- Available memory
- Operating status
Redfish Power Supply
The Redfish Power Supply sensor monitors the power supply of a Redfish-capable server, for example:
- Input voltage
- Input & output watts
- Power efficiency
- Power supply status
Redfish System Health
The Redfish System Health sensor monitors the the system health of a Redfish-capable server, for example:
- Fan status
- PCIe device status
- Power supply status
- System power status
- Thermal status
Your data center management at a glance – even while on the go
Set up PRTG in minutes and use it on almost any mobile device.


More than just a data center monitoring software: PRTG is the only network monitoring tool you need
Got a few sensors left to spare? Set up network monitoring that’s lightweight yet powerful. Paessler PRTG not only monitors your data center, but also your complete IT infrastructure.
Network bandwidth
How much traffic passes through your network? When and where do spikes in traffic occur? How does your traffic change over time? PRTG tells you all this and more. As a result, you can take all the necessary precautions to ensure that your network is running at optimal capacity. Find out more about bandwidth monitoring with PRTG.
Network protocols
PRTG uses a variety of network protocols for monitoring your entire network, such as SNMP, WMI, SSL, HTTP, FTP, SSH or DHCP. By keeping track of your IT infrastructure via all those protocols you ensure the smooth functioning and optimal performance of your network.
Oliver Jähn, IT Manager at the University of Bonn![]()
“For us, PRTG Network Monitor is the most effective tool for monitoring our IT infrastructure in the long run.”
Create innovative solutions with Paessler’s partners
Partnering with innovative vendors, Paessler unleashes synergies to create
new and additional benefits for joined customers.

KnowledgeRiver
Combining their tools to a powerful solution for advanced analysis and automation, KnowledgeRiver and Paessler enable IT teams to ensure best performance for their infrastructure and networks.


Start data center management with PRTG and see how it can make your network more reliable and your job easier.
Data center monitoring: FAQ
1. What is data center monitoring?
Data center monitoring refers to the process of collecting and analyzing data about the performance and operation of a data center's physical infrastructure, systems, and applications. The main goal of data center monitoring is to ensure that the data center is operating efficiently and effectively and to detect any potential issues before they become major problems.
2. Are there best practices for data center monitoring?
- Set up your monitoring environment: Install a data center monitoring tool like PRTG and integrate all your services, devices, applications, and metrics that you want to monitor. With the PRTG auto-discovery, this can be automatically done within minutes.
- Set up a notification system: To be alerted immediately when an issue arises, set up notifications and alarms in your monitoring tool. In PRTG, you can define thresholds for each monitoring metric and if a threshold is breached, you are immediately alerted.
- Review and analyze your collected monitoring data regularly. This helps to identify trends, areas for improvement, and gives you hints when to upgrade your infrastructure.
3. Can I monitor distributed data centers with PRTG?
You can monitor distributed data centers with PRTG using remote probes or setting up multiple PRTG servers. All monitoring data that you collect from your distributed data centers can be visualized on one single dashboard, which makes it way easier to keep track of your data center infrastructure and environment.
4. What is a sensor in PRTG?
In PRTG, “sensors” are the basic monitoring elements. One sensor usually monitors one measured value in your network, for example the traffic of a switch port, the CPU load of a server, or the free space on a disk drive.
On average, you need about 5-10 sensors per device or one sensor per switch port.

PRTG: The multi-tool for sysadmins
Adapt PRTG individually and dynamically to your needs and rely on a strong API:- HTTP API: Access monitoring data and manipulate monitoring objects via HTTP requests
- Custom sensors: Create your own PRTG sensors for customized monitoring
- Custom notifications: Create your own notifications and send action triggers to external systems
- REST Custom sensor: Monitor almost everything that provides data in XML or JSON format
We asked: would you recommend PRTG?
Over 95% of our customers say yes!
Paessler AG conducted trials in over 600 IT departments worldwide to tune its network monitoring software closer to the needs of sysadmins.
The result of the survey: over 95% of the participants would recommend PRTG – or already have.

Paessler PRTG is used by companies of all sizes. Sysadmins love PRTG because it makes their job a whole lot easier. Bandwidth, servers, virtual environments, websites, VoIP services – PRTG keeps an eye on your entire network. Everyone has different monitoring needs. That’s why we let you try PRTG for free.Still not convinced?
![]()
More than 500,000
sysadmins love PRTG![]()
Monitor your entire IT infrastructure
![]()
Try Paessler PRTG
for free
![]()
PRTG makes data center monitoring easy
Custom alerts and data visualization make it easy to monitor, identify, and prevent data center issues and outages.
|
PRTG |
Network Monitoring Software - Version 24.2.94.1400 (April 10th, 2024) |
|
Hosting |
Download for Windows and cloud-based version PRTG Hosted Monitor available |
Languages |
English, German, Spanish, French, Portuguese, Dutch, Russian, Japanese, and Simplified Chinese |
Pricing |
Up to 100 sensors for free (Price List) |
Unified Monitoring |
Network devices, bandwidth, servers, applications, virtual environments, remote systems, IoT, and more |
Supported Vendors & Applications |
|