 Originally published on July 28, 2013 by Gerald Schoch
Last updated on March 03, 2022
•
23 minute read
On a normal day as a system administrator, our colleagues, supervisors, and customers often want answers to common questions from us.
We have to deal with similar questions quite frequently:
You need to address those questions quickly and in a comprehensive way. And for this, you need something that supports you.
You might already know a lot of lists in PRTG that make life easier for you as system administrator: favorite devices, best uptime, fastest ping, highest bandwidth usage, slowest website, most available disk space, sensors with status down, etc. You can investigate your whole network with them to keep everything under control. Well, here is another helpful listing for you: This article presents ten everyday network issues as addressed to you like above and how you resolve these tasks quickly with PRTG.
Your IT infrastructure needs constant review. You have to ensure the health of your system-are there overloaded components, for example, CPU or memory? Is the temperature of your servers acceptable? Are there Windows servers that restart every now and then during the night and you are not aware of this issue, missing that there is something wrong? You also want to know when hard disks in your environment are going to be full, when there is going to be a lack of memory, or you need to upgrade your internet connection due to increasing bandwidth usage. If you know this, then you will also know when it is time to invest in new hardware resources.
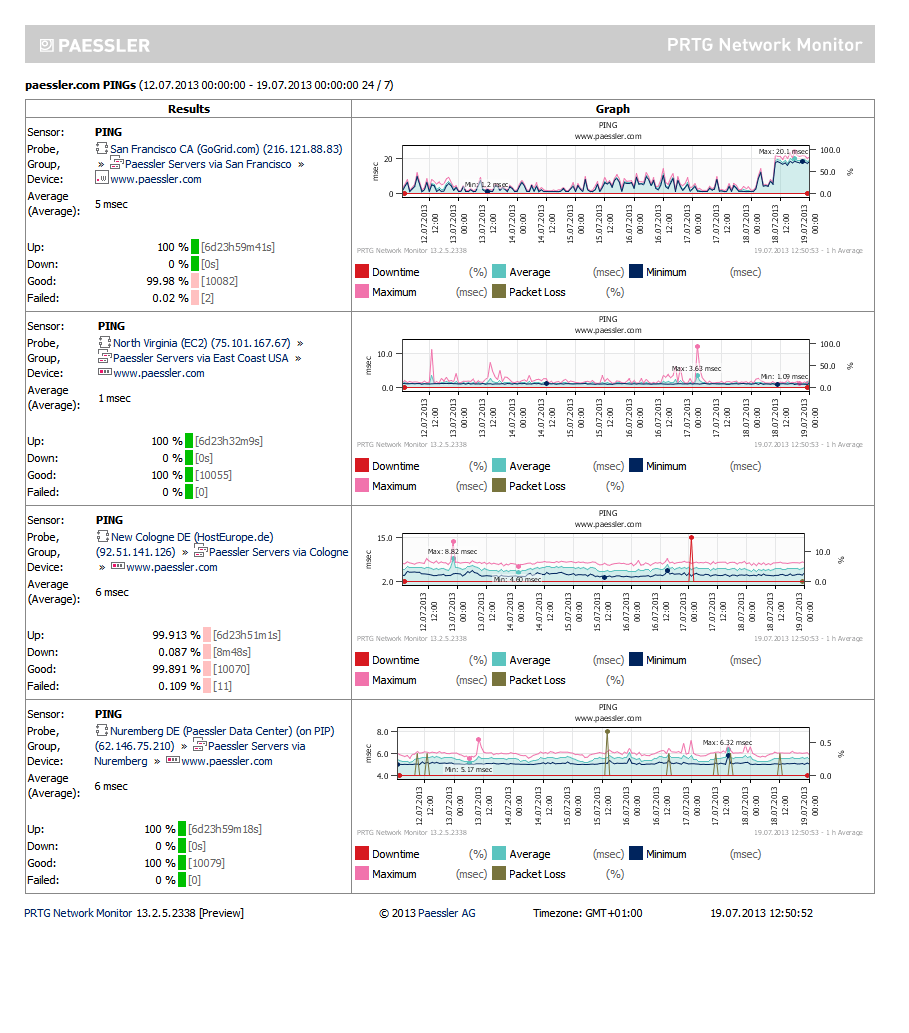
PRTG provides you detailed monitoring data and historical reports about all of your network components. Analyzing those, you can see usage trends in order to know when resources are going to run out. PRTG will warn you when something uncommon occurs like server outages, or when certain values reach a defined threshold and notifies you immediately. This way, you can react before things get really worse.
2. Detecting Security Issues in Your Network
How is it possible to be sure that your network is safe? On the one hand, it is important that antivirus scanners are running on all computers and that they are up to date. Furthermore, Windows has to run at the latest version in order to not miss various security updates. On the other hand, you might be already under attack in spite of that. If there are uncommon CPU and traffics peaks, this can indicate a potential attack. Or is there any suspicious traffic?
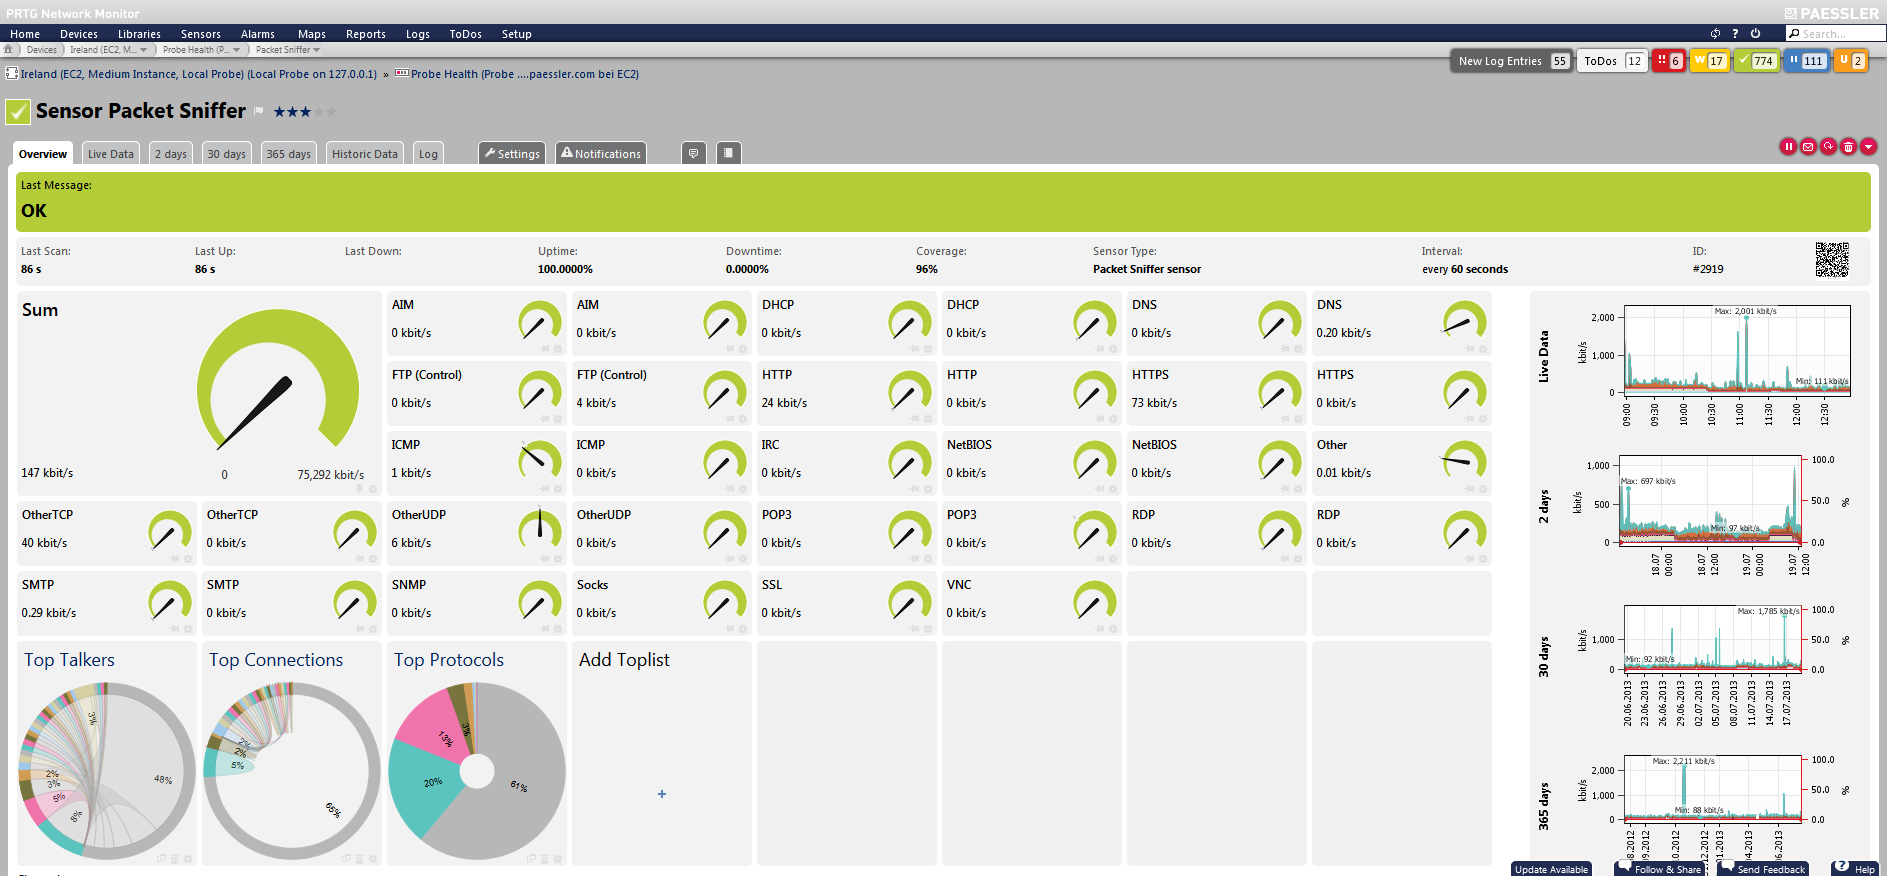
PRTG detects such unusual behavior and switches the corresponding sensors in the “unusual” status. You can also check the connections to your network: Are there connections through your firewall from unknown source addresses? Analyze this via the Toplists feature of several traffic sensors to be on the safe side. Another helpful feature for security monitoring is the similar sensor analysis which can help to recognize strange interconnections between sensors. Additionally, PRTG monitors the overall security status like antivirus software of a Windows computer with the WMI Security Center sensor and Windows server updates with the WSUS Statistics sensor.
3. Quality of Service: Bad Sound Quality in VoIP and Video Streaming Hiccups
When the sound quality of Voice over IP (VoIP) calls dramatically drops, or video streaming hiccups occur frequently, you need to investigate the relevant parameters like jitter, packet loss, or packet delay variation of the network connection. Which can be responsible for the problem? Both VoIP and video streaming services highly rely on a steady stream of data packets. For example, quality of service suffers when UDP packets are not received in a timely fashion, or if packets are lost or out of order.
PRTG is the perfect tool to find those issues. With the out-of-the-box Quality of Service (QoS) sensor, you can measure the quality of your network connection by sending UDP packets between two remote probes and analyzing various network parameters. You can also monitor VoIP relevant parameters through IP Service Level Agreement (SLA) results from Cisco devices. Just add PRTG's Cisco IP SLA Sensor and ensure that your network performance is suitable for VoIP.
Availability and loading times of web pages are a crucial point for companies-not only online shops need to be reachable day and night with acceptable performance. For web shops it is additionally very important that requests are working as expected. If a buying process fails due to technical errors, or browsing items on your page is a horrible experience, you will lose customers and money. The same holds if potential customers browse by to get information about your firm and the page is unacceptably slow.
In order to avoid possible loss of earnings for your company, PRTG alerts you immediately if anything goes wrong with your web page, or when it shows unusual behavior such as being too slow. Use the HTTP Full Web Page sensor, for example, that shows the loading time of the full page. The HTTP Transaction sensor measures loading times for performing transactions on an interactive web page. Or add an HTTP Apache ModStatus Totals Sensor to monitor accesses and transferred data to identify traffic peaks at specific times-know when it is time to provide more bandwidth!

5. Failure Safe Monitoring Without Gaps in Data
You control SLAs? You want to create reliable billing data? You depend on failure safe monitoring? Then you need to reach true high uptime for your monitoring tool! System uptime might be degraded by failing connections. Internet outages at a PRTG server's location, failing hardware, or because of a downtime due to a software upgrade of the operating system or PRTG itself, gaps in monitoring data can have several reasons.
In order to guarantee failure safe monitoring, PRTG provides failover clustering. This feature is included in every license without extra costs. There is a "Primary Master Node" and one or up to five "Failover Nodes", each node a full PRTG installation, in a LAN or at multiple locations around the world. Every node could perform the whole monitoring and alerting on its own for all your devices running on a cluster probe. Nodes are connected to each other and communicate in both directions. In a simple failover configuration, a node takes over the role of another node when that one has a downtime. This way, you avoid monitoring downtimes and make seamless monitoring and alerting independent from a single site, datacenter, or network connection.
6. Poor Database Performance
If database performance is low, you need to know where to assess in order to optimize your database's performance. Unfortunately, examining the reason for bad performance of, for example, SQL servers can be a painful task.
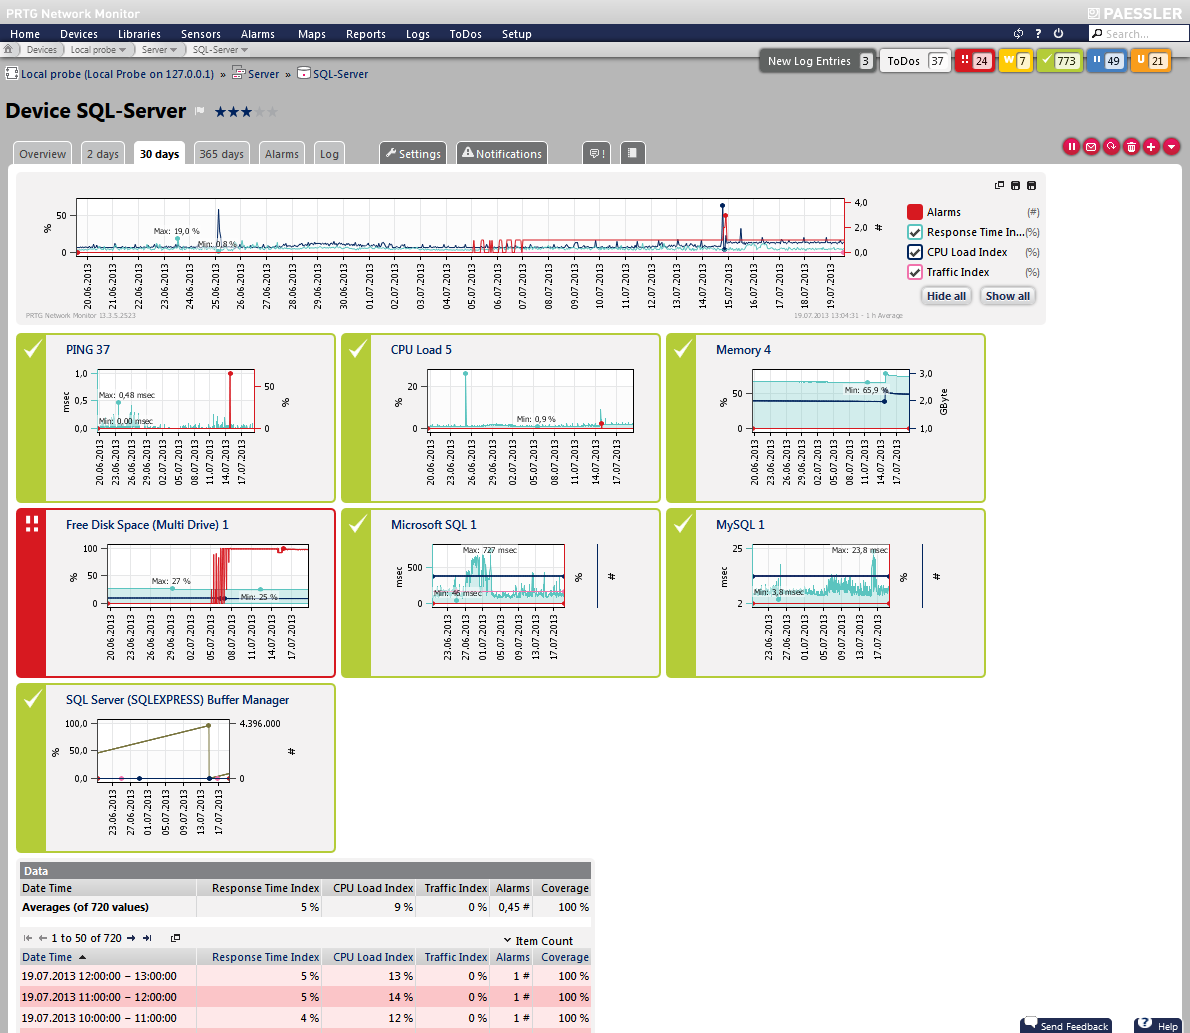
PRTG supports you in maintaining your database. For example, WMI Microsoft SQL Server sensors show you the number of user connections. If the performance is low at specific times, this might be a result of overly high numbers of user connections at the same time. This sensor can also show the percentage of pages found in the buffer cache without having to read from disk. If this number is too low and PRTG makes you immediately aware of this, you can increase the amount of memory available to the SQL server. Or do you send inefficient queries? PRTG measures the response time of queries and can check if the response value is the expected one.
7. Time Consuming Printer Maintenance
You as system administrator do not want to waste your precious time by manually checking the status of the printers in your IT infrastructure every day. It is also sometimes annoying when you are at concentrated work-fixing the SQL server issues PRTG notified you of recently-and you are called to the floor above because of a lack of papers.
PRTG provides you the solution: For example, use the Windows Print Queue sensor to monitor all jobs on a print server. If paper is running out, you get a warning message from PRTG and can react before demands of colleagues come in. Or monitor hardware parameters of your HP LaserJet printers with a natively available sensor. Get a notification when the toner is low. Or, even better, let PRTG automatically send an email to your supplier to bring new toners and exchange the old one. You do not have to worry about the status of printers anymore.
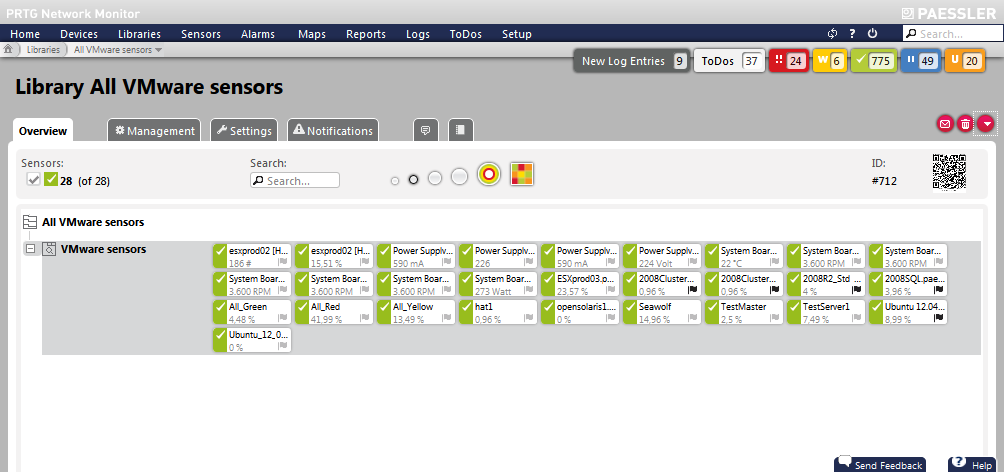
It is important to have always an eye on virtual machines in times of highly flexible IT infrastructures where virtualization plays a major role. Problems with virtual machines can have several reasons. PRTG provides you with various sensors addressing these issues. Add a VMware Virtual Machine sensor to PRTG and monitor CPU and memory usage of your virtual machines via SOAP, as well as the network speed of a single virtual machine. But what if speed is too slow or memory is overloaded on a VM?
Good that you can also monitor the host hardware with PRTG. You can understand immediately if problems with your virtual machines have their origins in a host hardware failure. If the general status of your VMware host is other than "normal", then the issue will be reported in the sensor message. Because of PRTG's dependencies feature, you most probably will not have to spend a lot of time to investigate if a single VM or the hardware causes the problems.
9. Failing Windows Services and Server Hang-Ups
If a service on a server fails, one of the most common methods for recovery is to reboot of the whole server to get the failing service back online. When monitoring Windows services, you will receive a notification by SMS, email, etc., in case of a service outage. But sometimes it would be even more useful if the following reboot would be done automatically. The same holds for occasional system hang-ups. In this case, Windows services will stop. PRTG recognizes this and sends a notification, but rebooting has to be done manually.
With PRTG's notification system you can accomplish automatic rebooting easily. In particular, PRTG's notifications can do more than just notifying. Just create a script that reboots services or the whole system and invoke it to an "Execute Program" notification. If a service or server is down for a defined time span, PRTG executes this script and restarting is achieved without your intervention. When monitoring specific Windows services via PRTG's WMI Service sensor, it is even possible to choose an automatic restart option if a service is not running.
Sometimes it is necessary to take devices out of service. This can be, for example, due to maintenance reasons. Or you shut down systems at the weekend or at night, or you just do not want to be notified at certain times. But you really do not want to get alerts from PRTG because of these planned system downtimes-PRTG just does its job in these moments, trying to achieve high system availability by notifying you. Of course, pausing monitoring of certain sensors in your big network manually is not worth the effort.
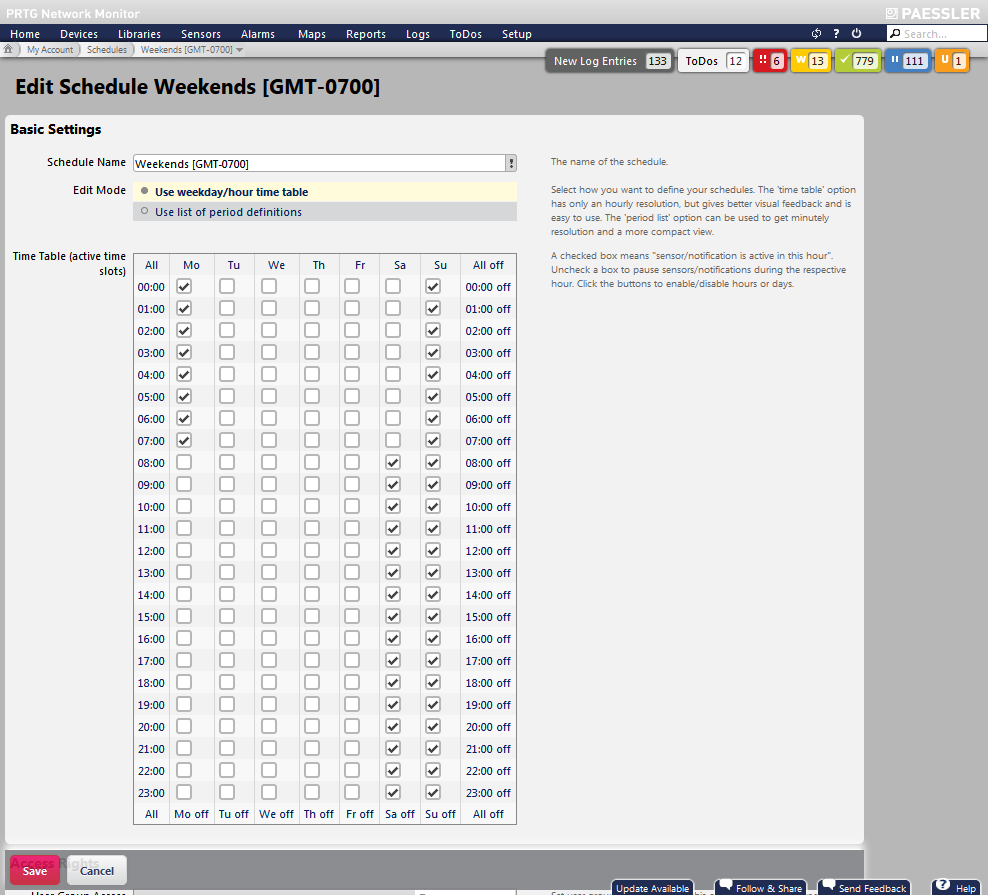
Fortunately, our developers implemented a dedicated feature for maintenance and other planned downtimes. For every group, device, or any other object, you are able to define schedules to limit monitoring time automatically. This way, false alarms will be avoided and you will not be notified about the downtime. And if you do not want to receive any more notifications about a down status of a specific sensor, you can acknowledge this alarm.
Wondering why your monitoring solution does not provide you quick answers to those questions in a comprehensible way? It's time to try PRTG—for free!