 Originally published on October 08, 2009 by Dirk Paessler
Last updated on March 03, 2022
•
6 minute read
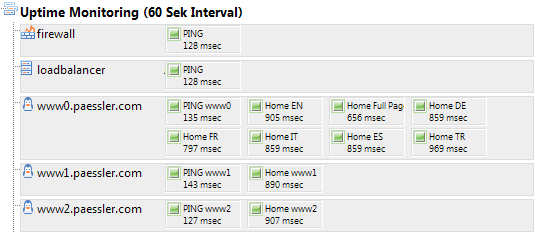
User Perspective
Is the website online? Does the server deliver more than error messages? How fast do pages load? Does the shopping cart process work? All questions can only be answered when the actual monitoring takes place from somewhere outside your servers and even their data center. We use our PRTG Network Monitor on cloud servers from GoGrid (in San Francisco) and Amazon EC2 (US East Coast and Ireland) as well as on servers in our own office datacenter in Nuernberg, Germany, to monitor our production servers - all four locations are quite reliable so it actually makes sense to use these. Here is what we monitor for our site www.paessler.com from a distance:
- PING to the firewall which secure our servers (every 30 seconds)
- PING to the HTTP load balancer
- PING to the actual web servers
- HTTP/HTTPS sensors that
- monitor load time for the homepage and the 5 most important other pages
- check: does the HTML from the server contain specific words
- check: does the HTML not include words like "error"
- monitor load time of our public downloads
- monitor all translations of the website
- HTTP Transaction monitoring (this sensor type walks through a series of URLs) checks that website visitors can put a product into the shopping cart and successfully pass the checkout
- a Full Page sensor (this sensor type not only requests the HTML of a page, but also all other page elements like CSS, images, Flash etc.)
We had to set up those HTTP sensors for each of our four web servers and for the load balancer, too. Alarms: Whenever one of the sensors finds a problem, alarms are sent to our admins. We stop monitoring of the other sensors, when we can not ping the firewall, because than obviously the connection to the data center itself is down. Here is a screenshot of some of the sensors I have mentioned:
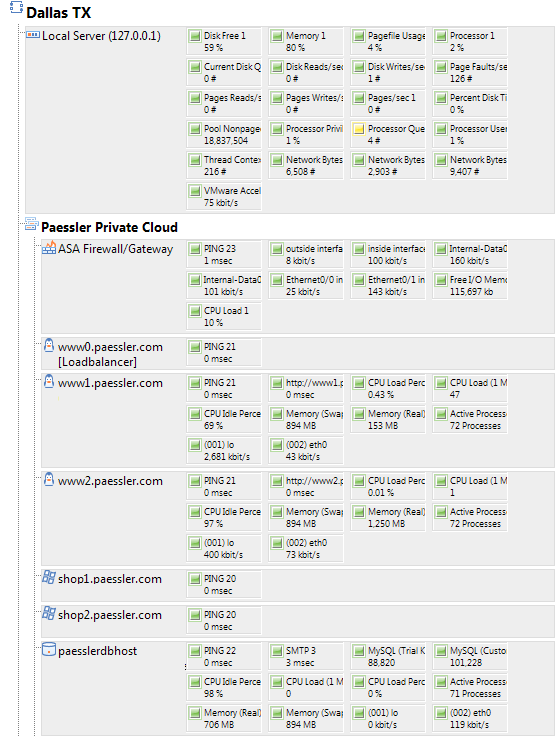
Server Perspective
Are the servers healthy? How high is CPU load and memory usage? Is enough diskspace available? These questions can not be answered from the outside. You either must run a monitoring software on the server(s) or must have a monitoring tool that can monitor the server through local probes/agents or gets internal information via scripts. We run Remote Probes of PRTG on our production servers to monitor the following parameters of each server (we have 5 production servers):
- CPU load
- memory usage (page files, swap file, page faults, etc.)
- network traffic
- disk usage, free disk space and disk read/write times
- overall system parameters (e.g. processor queue length, context switches)
- http request times of the webserver
Plus we monitor system health of the ASA Firewall (bandwidth usage, memory, cpu) and our SQL server. Alarms: If any of these health variables is outside a desired range (e.g. CPU load above 95% for more than 2/5 minutes) our monitoring solution will send alarms to our admins. Here is a screenshot of most of our sensors on the production systems: